


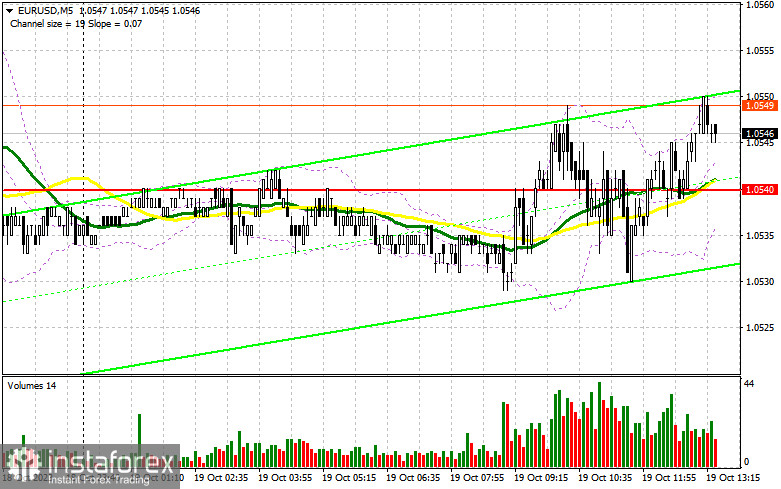
In the morning forecast, I emphasized the level of 1.0540 and recommended using it as a basis for market entry decisions. Let's examine the 5-minute chart and analyze what happened there. While there was an increase towards 1.0540, a proper entry point did not materialize. The primary issue was the market's low volatility. In the latter half of the day, the technical landscape was completely revised.
For opening long positions on EUR/USD, the following is required:
During the American session, there is a wealth of data and Federal Reserve representatives' speeches. We expect figures regarding initial jobless claims, the Philly Fed Manufacturing Index, and existing home sales. Strong data would serve as another reminder that the Fed may consider raising interest rates during the November meeting. Specifically, we'd like to hear about their plans from FOMC members such as Philip N. Jefferson, Ostan D. Goolsby, and Michael S. Barr. However, the focus will likely be on the speech of Federal Reserve Chairman Jerome Powell. If the pair decreases, it's better to act after a false breakout is formed at the level of 1.0531, which was established after the first half of the day. This would signal an entry into long positions with the goal of refreshing the resistance at 1.0563, which we've been unable to reach. Only a breakthrough and a top-down test of this range amid weak U.S. statistics would strengthen the demand for the Euro, providing a chance for further correction and a leap to 1.0594. The ultimate target will be around 1.0617, where I will take profits. In the event of a EUR/USD decrease and no activity at 1.0531 during the second half of the day, the bears will regain control of the market, and trading will shift into a new downward channel. In such a scenario, only a false breakout forming around 1.0497 will signal Euro purchases. I will consider opening long positions after a rebound, starting at 1.0474, with the goal of an upward correction within the day of 30-35 points.
For opening short positions on EUR/USD, the following is required:
Sellers have yet to make their presence felt. If the pair rises and there's a bullish reaction to statements by American politicians, only the formation of a false breakout at the level of 1.0563, just below which the moving averages that favor sellers pass, would provide a signal to sell, moving down to a new support level of 1.0531. We can only talk about controlling the market after a breakthrough and consolidation below this range, along with a bottom-up test, resulting in a selling signal with an exit at 1.0497. The ultimate target will be the minimum of 1.0474, where I will take profits. In the event of EUR/USD rising during the American session due to the Federal Reserve Chairman's dovish statements and the absence of bears at 1.0563, buyers might achieve a breakout of this level. In this scenario, I will postpone short positions until the resistance reaches 1.0594, which we've fallen from several times this week. Selling is possible there, but only after an unsuccessful breakout. I will consider opening short positions immediately after a rebound from the maximum of 1.0617, with the goal of a 30-35 point downward correction.
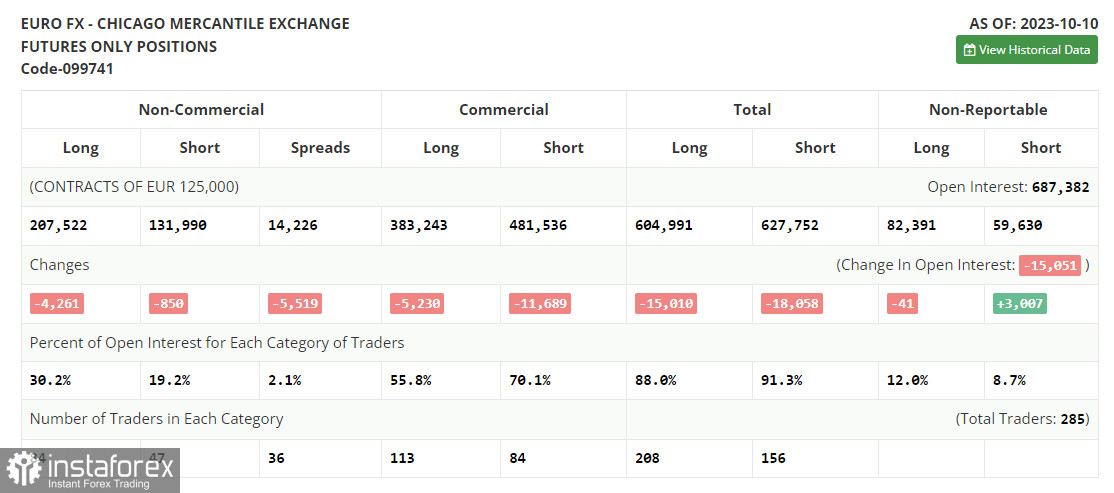
In the COT report (Commitment of Traders) for October 10, there was a reduction in both long and short positions. Considering the recent U.S. data releases and the high inflation recorded in September, traders and economists have started to doubt whether the Federal Reserve will continue its pause or resume raising borrowing costs during the November meeting. Given the Israel-Hamas conflict and its negative consequences for the global economy, the demand for risk assets has sharply declined, which further impacts the European currency negatively. The European Central Bank's tough stance presents yet another challenge for the Euro as the Eurozone's economy continues to contract. The only positive aspect is the significantly depreciated euro, which continues to attract traders' attention. The COT report shows that long non-commercial positions decreased by 4,261 to the level of 207,522, while short non-commercial positions decreased only by 850 to the level of 131,990. As a result, the spread between long and short positions decreased by 5,519. The closing price increased to 1.0630 from 1.0509, confirming a minor upward correction for the euro.
Indicator Signals:
Moving Averages
Trading is conducted around the 30-day and 50-day moving averages, indicating a sideways market.
Note: The author considers the period and prices of the moving averages on the H1 hourly chart, which differs from the general definition of classical daily moving averages on the D1 daily chart.
Bollinger Bands
In the case of a decline, the lower boundary of the indicator around 1.0531 will act as support.
Description of indicators:
• Moving Average (determines the current trend by smoothing volatility and noise). Period 50. Marked in yellow on the chart.
• Moving Average (determines the current trend by smoothing volatility and noise). Period 30. Marked in green on the chart.
• MACD Indicator (Moving Average Convergence/Divergence) Fast EMA period 12. Slow EMA period 26. SMA period 9.
• Bollinger Bands. Period 20.
• Non-commercial traders - speculators, such as individual traders, hedge funds, and large institutions, using the futures market for speculative purposes and meeting specific requirements.
• Long non-commercial positions represent the total long open positions of non-commercial traders.
• Short non-commercial positions represent the total short open positions of non-commercial traders.
• The total non-commercial net position is the difference between the short and long positions of non-commercial traders.


