EUR/USD
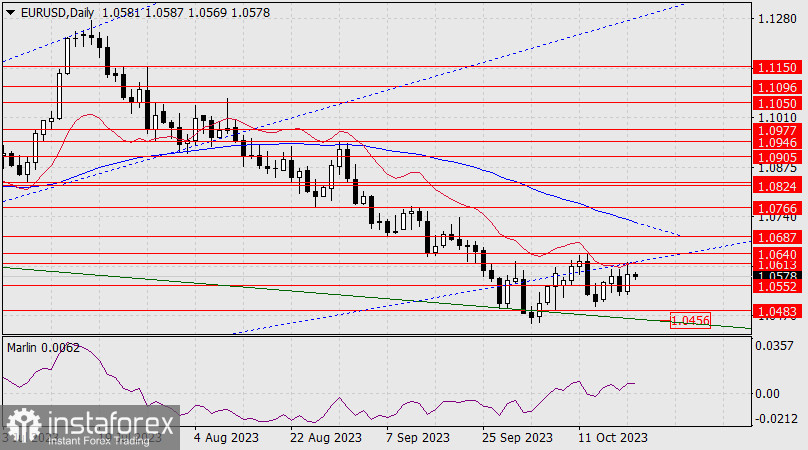
Yesterday, the upper shadow of the daily candle reached a crucial point – the intersection of the target level at 1.0613, a Fibonacci ray, and the balance indicator line. The price is currently decreasing, and if it breaks the support level at 1.0552, this would raise the risk of the pair falling to 1.0456. The Marlin oscillator is rising in the bullish territory, mitigating the pressure of the growing bearish potential.

In theory, the price can continue to move sideways for a long time, but since we have an ascending Fibonacci ray, time is working against the price. Because every time the price delays its steady upward movement, the resistance increases by 4 pips. In two weeks, the price will encounter the resistance level of the MACD line, which it may not overcome since it will still be below the Fibonacci ray. Therefore, if the euro is not confident in its strength, the price can fall without an attempt at further consolidation. The first signal will be when the price falls below the support level at 1.0552.

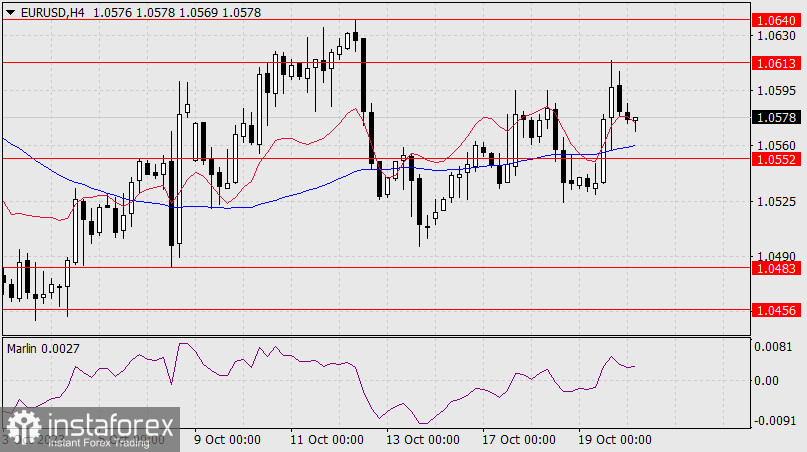
On the 4-hour chart, the price is trying to overcome the MACD line and the 1.0552 level. Marlin is still in the positive territory, but if the price attacks these levels, it can easily move into the negative territory. We await further developments. The stock market exerts pressure on the euro; yesterday, the S&P 500 fell by 0.85%.


