


Analysis of macroeconomic reports:
There's a full plate of macroeconomic events slated for Tuesday. PMIs will be published in Germany, the UK, the European Union, and the US. In total, there will be 12 of them. Market participants will keep an eye on the Manufacturing and Services PMIs, which amount to 8 in total. In the US, these indices have an indirect value since the ISM PMIs are more important. This leaves us with 6 PMIs, and all of them will be published early in the morning. This should be sufficient to stir some market reaction, so the volatility may gradually increase during the European session. We do not expect a strong improvement in business activity in Europe and the UK, so the euro and pound will find it challenging to gain support.
Traders can also monitor UK reports on unemployment rate and jobless claims. These are not crucial reports, but the second one can affect the pound's movement if its value deviates significantly from the forecast. Usually, we talk about the resonant actual value of the indicator, but this time we will mention the resonant forecast, which is -198,000. There is a high probability that the actual value will deviate significantly.
Analysis of fundamental events:
There will be no fundamental events on Tuesday. This may be for the better, as it will be less confusing for traders. However, 95% of all recent speeches by representatives of the Bank of England, the European Central Bank, and the Federal Reserve have had no immediate impact on the movement of various currency pairs. Only Fed Chair Jerome Powell's speech last week provoked a "storm" in the market.
General conclusion:
No highly crucial reports on Tuesday, but there will be a multitude of moderately important reports that could collectively have a fairly strong influence on the movement of both currency pairs. We support a continuation of the upward correction, but after Monday's rise, a pullback may follow. The second leg of the correction could take some time.
Basic rules of a trading system:
1) Signal strength is determined by the time taken for its formation (either a bounce or level breach). A shorter formation time indicates a stronger signal.
2) If two or more trades around a certain level are initiated based on false signals, subsequent signals from that level should be disregarded.
3) In a flat market, any currency pair can produce multiple false signals or none at all. In any case, the flat trend is not the best condition for trading.
4) Trading activities are confined between the onset of the European session and mid-way through the U.S. session, post which all open trades should be manually closed.
5) On the 30-minute timeframe, trades based on MACD signals are only advisable amidst substantial volatility and an established trend, confirmed either by a trend line or trend channel.
6) If two levels lie closely together (ranging from 5 to 15 pips apart), they should be considered as a support or resistance zone.
How to read charts:
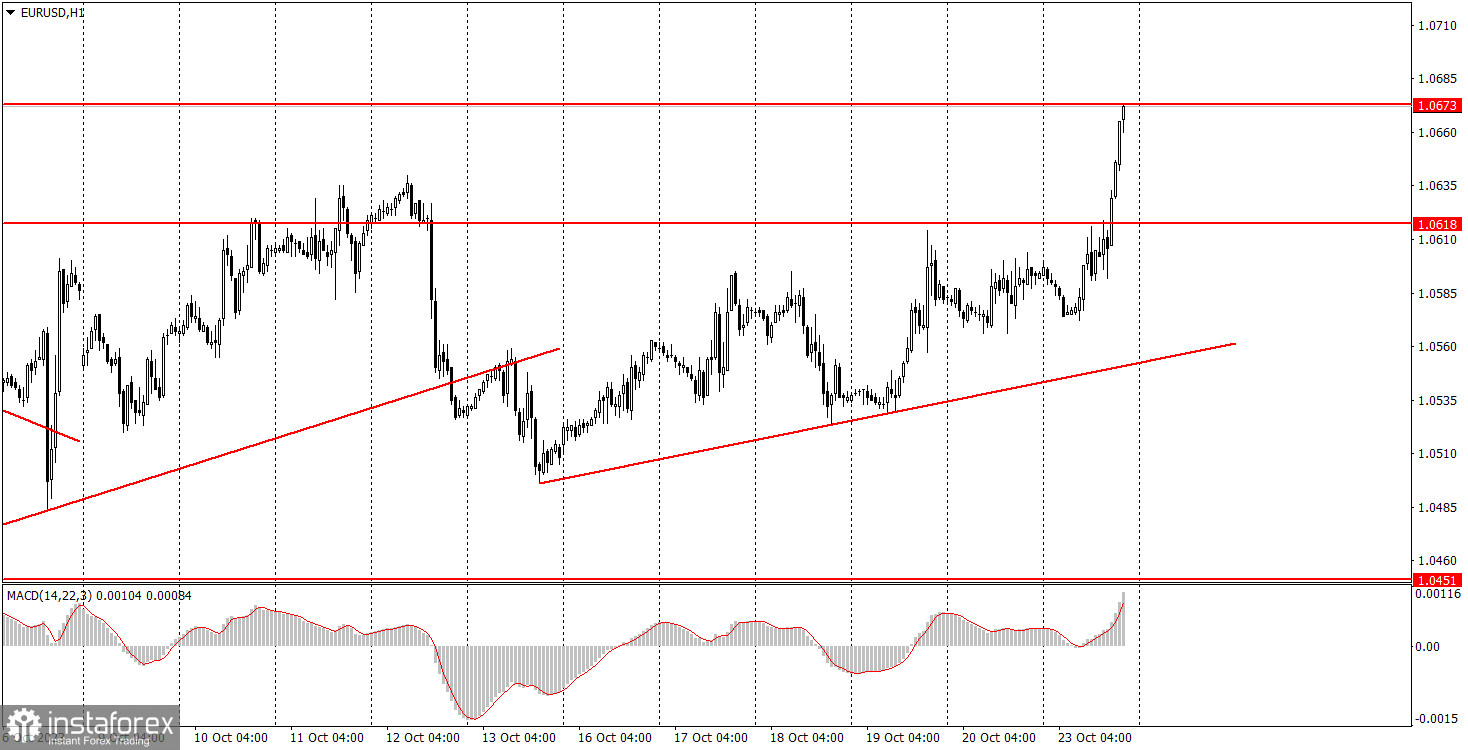
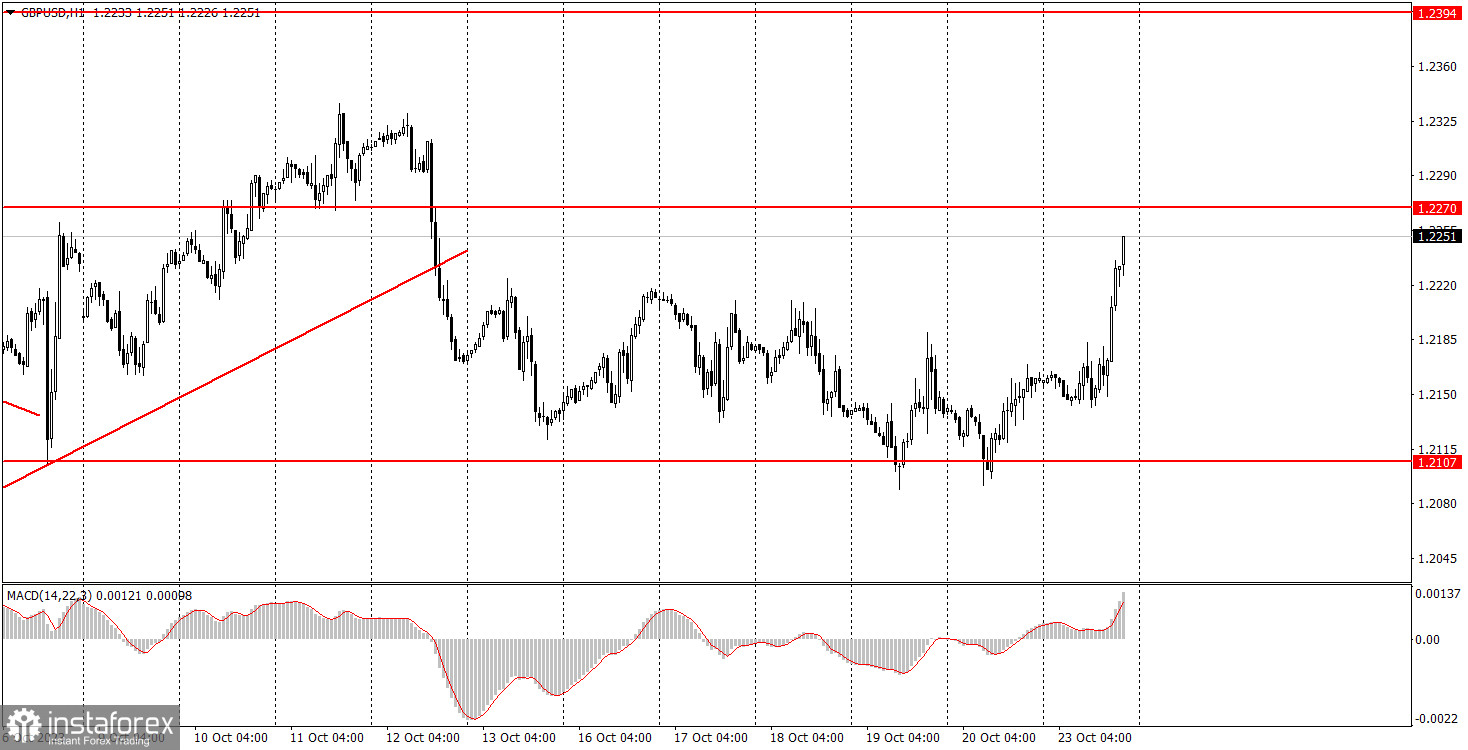
Support and Resistance price levels can serve as targets when buying or selling. You can place Take Profit levels near them.
Red lines represent channels or trend lines, depicting the current market trend and indicating the preferable trading direction.
The MACD(14,22,3) indicator, encompassing both the histogram and signal line, acts as an auxiliary tool and can also be used as a signal source.
Significant speeches and reports (always noted in the news calendar) can profoundly influence the price dynamics. Hence, trading during their release calls for heightened caution. It may be reasonable to exit the market to prevent abrupt price reversals against the prevailing trend.
Beginning traders should always remember that not every trade will yield profit. Establishing a clear strategy coupled with sound money management is the cornerstone of sustained trading success.


