


Trend analysis (Fig. 1).
The EUR/USD currency pair may move upward from the level of 1.0669 (closing of yesterday's daily candle) to test 1.0707, the historical support level (blue dotted line). Upon testing this level, a downward movement is possible to 1.0643, the 23.6% pullback level (blue dotted line). In the case of testing this level, the price may move up.
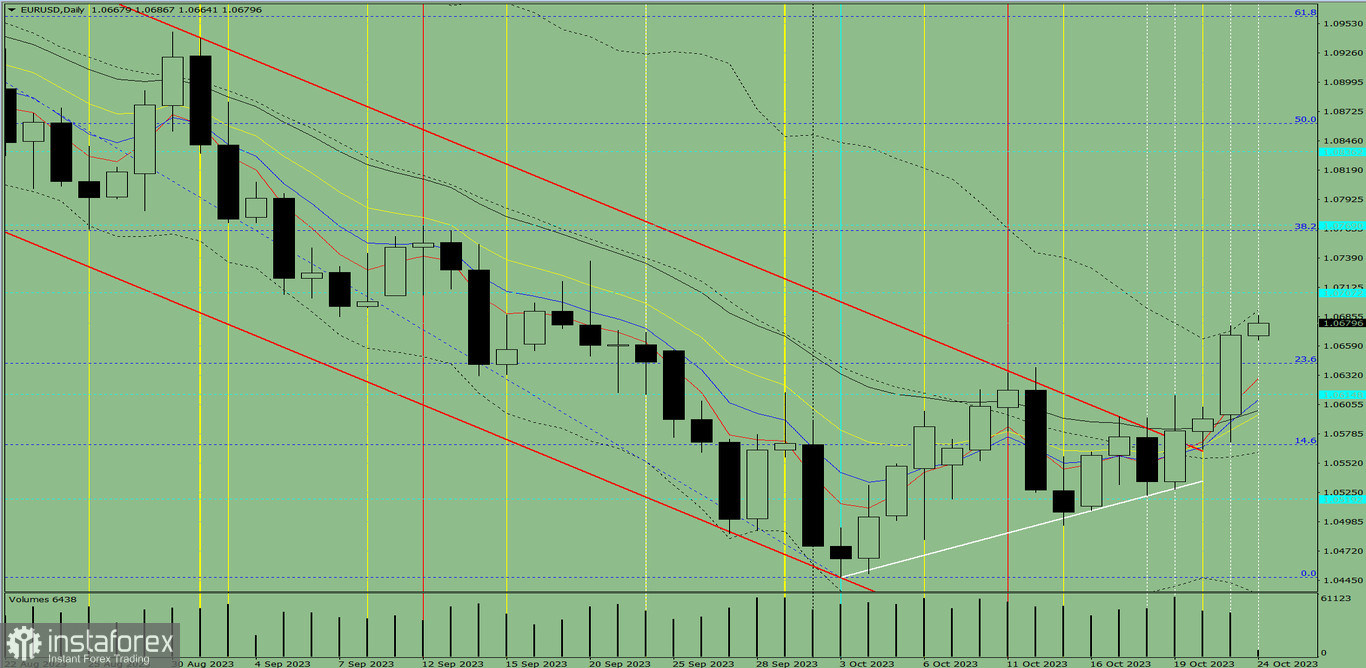
Fig. 1 (daily chart).
Comprehensive analysis:
- Indicator analysis – up;
- Volumes – up;
- Candlestick analysis – up;
- Trend analysis – up;
- Bollinger bands – up;
- Weekly chart – up.
General conclusion: Today, the price may move upward from the level of 1.0669 (closing of yesterday's daily candle) to test 1.0707, the historical support level (blue dotted line). Upon testing this level, a downward movement is possible to 1.0643, the 23.6% pullback level (blue dotted line). In the case of testing this level, the price may move up.
Alternatively, the price may move upward from the level of 1.0669 (closing of yesterday's daily candle) to test the upper limit of the Bollinger Band indicator at 1.0692 (black dotted line). Upon testing this level, a downward movement is possible with a target at 1.0643, the 23.6% pullback level (blue dotted line).


