


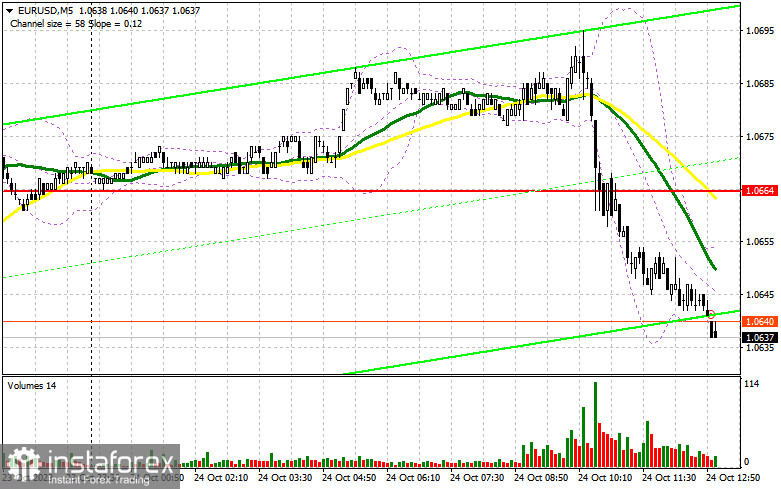
In my morning forecast, I drew attention to the level of 1.0664 and recommended making entry decisions based on it. Let's take a look at the 5-minute chart and analyze what happened there. The decline towards 1.0664 did occur, but we never received a buy signal for the euro. Missing the 1.0664 level only increased pressure on the pair by midday. The technical analysis for the second half of the day was completely revised.
To open long positions on EUR/USD, the following is required:
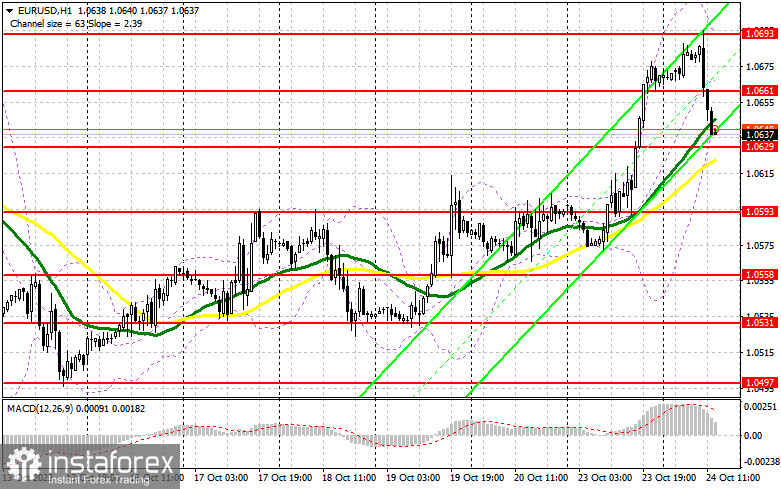
Very weak data on activity in the manufacturing and service sectors of the Eurozone led to an instant sell-off of the euro, which I specifically pointed out in my morning forecast. Similar data for the United States is ahead of us, so we can expect considerable volatility. Strong statistics, which are currently fine in the USA, will lead to further declines in the pair. Therefore, I recommend focusing on protecting the nearest support level at 1.0629, where the moving averages are currently favoring the bulls. A false breakout at this level would signal an entry point for long positions with the target of recovery towards the 1.0661 resistance area. Only a breakthrough and top-down retest of this range will renew demand for EUR/USD, providing an opportunity for further correction and a move towards the weekly high at 1.0693. The ultimate target is the 1.0734 area, where I would take a profit. If EUR/USD declines and there is no activity at 1.0629 in the second half of the day, the bears will regain control of the market. In this case, only a false breakout around 1.0593 would provide a buy signal for the euro. I would consider opening long positions upon a rebound from 1.0558, with a target of a 30-35 point upward correction within the day.
To open short positions on EUR/USD, the following is required:
Sellers have shown themselves rather aggressively after the economic data, and it appears they are now aiming to undo all of yesterday's gains. In the event of weak data and a surge in the euro in the second half of the day, protecting the 1.0661 level will be a top priority. The formation of a false breakout there will signal a sell-off with a move downward to the new support level at 1.0629. We can only talk about control of the market after a breakthrough and a close below this range, as well as a bottom-up retest, which would signal a sell-off with a move to 1.0593. The ultimate target will be the minimum level of 1.0553, where I would take a profit. In the event of an upward movement in EUR/USD during the American session and a lack of bears at 1.0661, the bull market will continue. In this scenario, I would postpone short positions until the 1.0693 resistance, the maximum for this month, with selling only after an unsuccessful consolidation. I would consider opening short positions upon a rebound from the 1.0734 maximum, aiming for a downward correction of 30-35 points.
Indicator signals:
Moving averages
Trading is conducted above the 30 and 50-day moving averages, indicating the possibility of further growth in the euro.
Note: The period and prices of moving averages considered by the author are on the hourly H1 chart and differ from the general definition of classical daily moving averages on the daily D1 chart.
Bollinger Bands
In case of a decline, the lower boundary of the indicator around 1.0635 will act as support.
Description of Indicators:
Moving average (determines the current trend by smoothing out volatility and noise). Period 50. Marked in yellow on the chart.Moving average (determines the current trend by smoothing out volatility and noise). Period 30. Marked in green on the chart.MACD Indicator (Moving Average Convergence/Divergence – convergence/divergence of moving averages). Fast EMA period 12. Slow EMA period 26. SMA period 9.Bollinger Bands. Period 20.Non-commercial traders – speculators, such as individual traders, hedge funds, and large institutions using the futures market for speculative purposes and meeting specific requirements.Long non-commercial positions represent the total long open positions of non-commercial traders.Short non-commercial positions represent the total short open positions of non-commercial traders.The total non-commercial net position is the difference between the short and long positions of non-commercial traders.

