


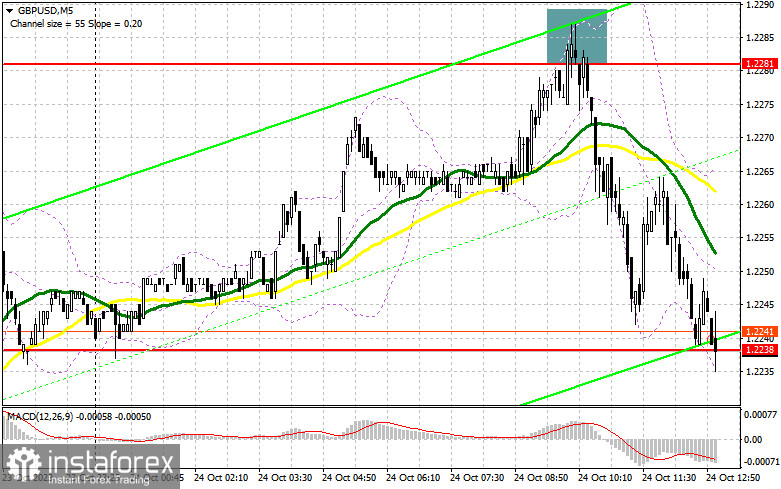
In my morning forecast, I drew attention to the level of 1.2281 and recommended making decisions based on it for market entry. Let's take a look at the 5-minute chart and analyze what happened there. Growth and the formation of a false breakout at this level led to an excellent selling entry point, resulting in a drop in the pair by more than 40 points. The technical picture was completely revised for the second half of the day.
To open long positions on GBP/USD, the following is required:
Weak data on activity in the United Kingdom negated the good labor market report, leading to a pound retreat from the weekly high. The second half of the day promises to be quite interesting as reports on business activity in the manufacturing sector, the service sector, and the composite PMI of the United States are scheduled. Strong indicators will lead to further declines in the pair; however, the lower the pound is today, the better for buyers. I plan to act on buying only after the formation of a false breakout around 1.2219, where moving averages that favor bulls intersect. In this case, the target will be the nearest resistance at 1.2253, formed at the end of the European session. Breaking and holding above this range will allow buyers to re-enter the market, giving them a chance to update at 1.2285. The furthest target will be the area around 1.2310, where I will take a profit. In the scenario of the pair's decline in the second half of the day and the absence of activity at 1.2219 from buyers, things will take a bad turn. Only a false breakout in the support area at 1.2188 will signal the opening of long positions. I plan to buy GBP/USD right away on a bounce only from the minimum of 1.2150, targeting a correction of 30-35 pips during the day.
To open short positions on GBP/USD, the following is required:
Sellers have shown themselves and are now focused on further declines and refreshing the support at 1.2219. In the case of weak data from the United States, we will surely see a corresponding market reaction, leading to a surge in the pound. In this case, a false breakout in the area of the nearest resistance at 1.2253 will signal a sale, similar to what I discussed earlier, capable of pushing the pair down to 1.2219. Breaking and reverse testing of this range from bottom to top will deliver a more severe blow to the positions of the bulls, paving the way for 1.2188 and allowing for a complete wipeout of yesterday's gains. A more distant target will be the minimum of 1.2150, where I will take a profit. In the scenario of GBP/USD rising during the American session and the absence of activity at 1.2253 in the second half of the day, the demand for the pound will return, and buyers will have a chance to regain control of the market. In this case, I will postpone selling until a false breakout at 1.2285. In the absence of downward movement even there, I will sell GBP/USD right away on a bounce from 1.2310, but only with the expectation of a downward correction of 30-35 points.
Indicator Signals:
Moving Averages
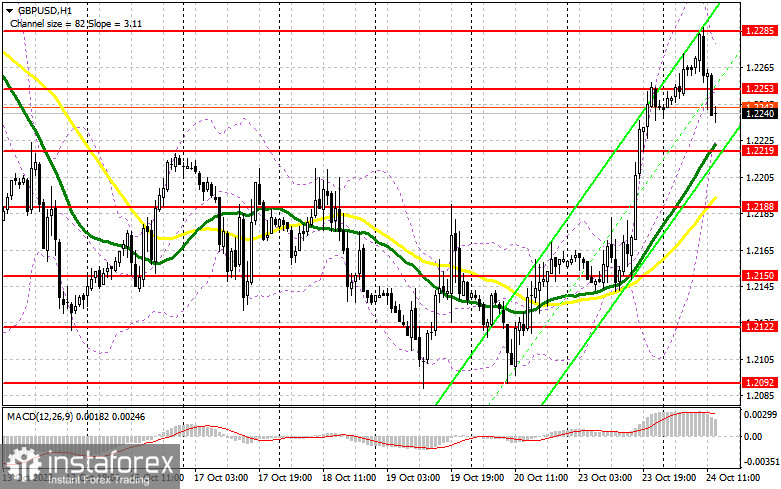
Trading is taking place above the 30 and 50-day moving averages, indicating an attempt for the pound to rise.
Note: The author considers the period and prices of the moving averages on the hourly chart H1, which differs from the general definition of classic daily moving averages on the daily chart D1.
Bollinger Bands
In case of a decrease, the lower boundary of the indicator at around 1.2219 will act as support.
Description of indicators
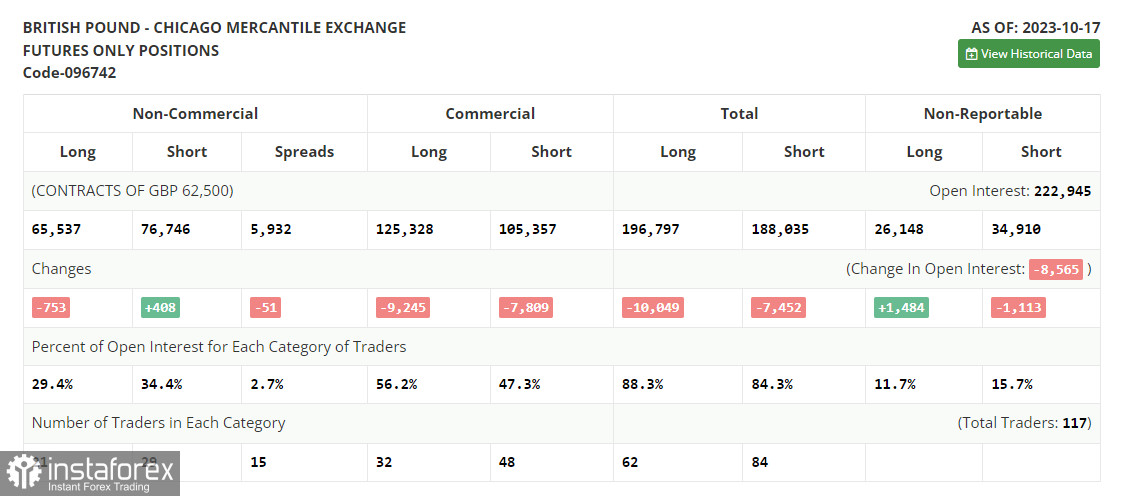
Moving Average (determines the current trend by smoothing volatility and noise). Period 50. Marked on the chart in yellow.Moving Average (determines the current trend by smoothing volatility and noise). Period 30. Marked on the chart in green.MACD Indicator (Moving Average Convergence/Divergence – convergence/divergence of moving averages) Fast EMA period 12. Slow EMA period 26. SMA period 9.Bollinger Bands. Period 20.Non-commercial traders – speculators, such as individual traders, hedge funds, and large institutions, using the futures market for speculative purposes and meeting specific requirements.Long non-commercial positions represent the total long open positions of non-commercial traders.Short non-commercial positions represent the total short open positions of non-commercial traders.The total non-commercial net position is the difference between the short and long positions of non-commercial traders.

