


Analysis of EUR/USD 5M
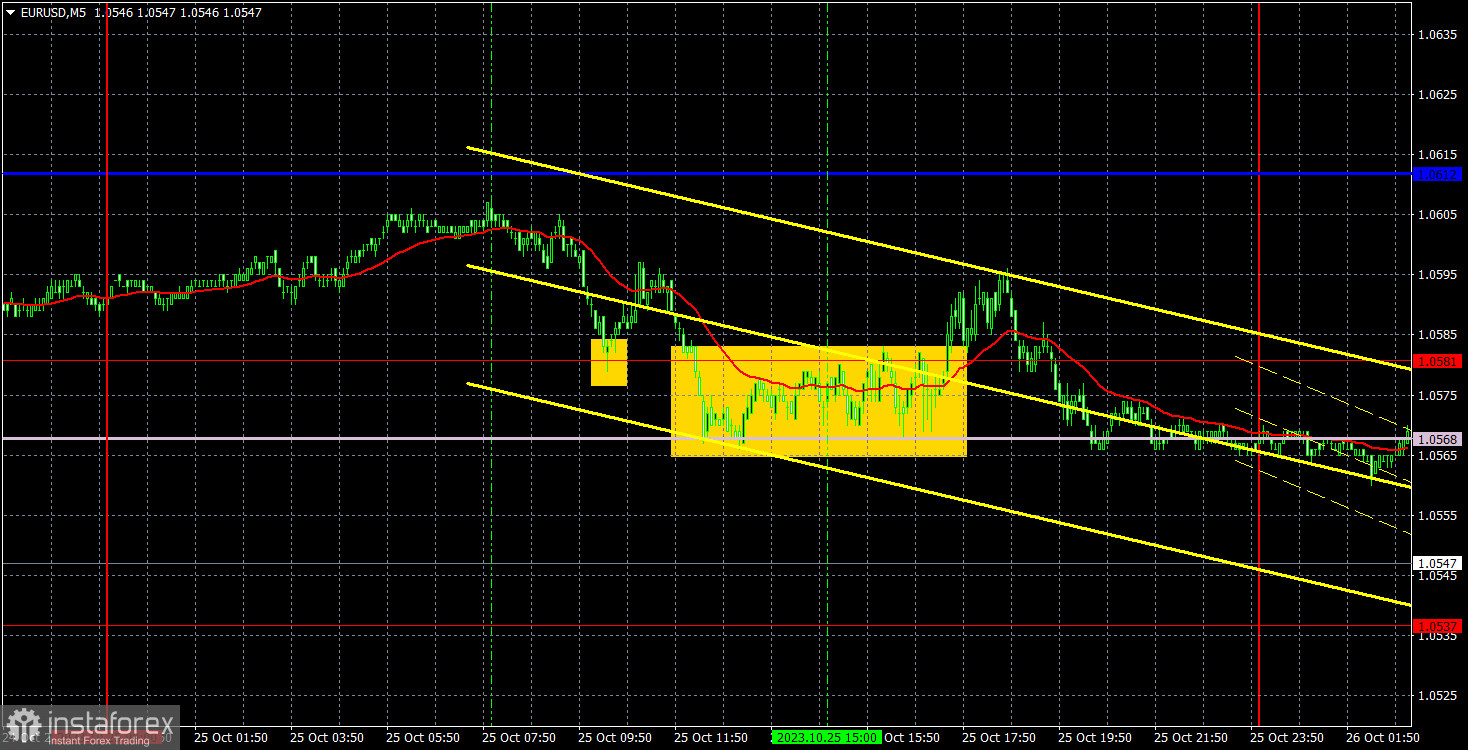
The EUR/USD pair faced strong negative pressure, even though there were no apparent reasons for it to fall. This week, we have witnessed some interesting and volatile movements, but it would be quite difficult to explain why the pair moved the way it did. From a technical perspective, everything was working just fine. We were expecting the second leg of the bullish correction, and it happened. Subsequently, the corrective phase reasonably ended, and the medium-term downtrend resumed. At this point, the pair has already crossed all the Ichimoku indicator lines and settled below the ascending trendline. Traders are selling even without any economic or fundamental reasons. Among the significant events on Wednesday, we highlighted the speeches of Federal Reserve Chairman Jerome Powell and European Central Bank President Christine Lagarde. But Lagarde didn't provide any interesting information, and Powell spoke late in the evening so his speech couldn't influence the pair's movements.
Despite the recommencement of the downward movement, it seemed more like a flat during the European and US sessions, and volatility also left much to be desired. As a result, trading signals were less than optimal. The pair rebounded from the 1.0568-1.0581 range twice and couldn't even move in the intended direction by 15 pips. However, there was no sell signal during the day, so traders could close the long position at or near breakeven.
COT report:
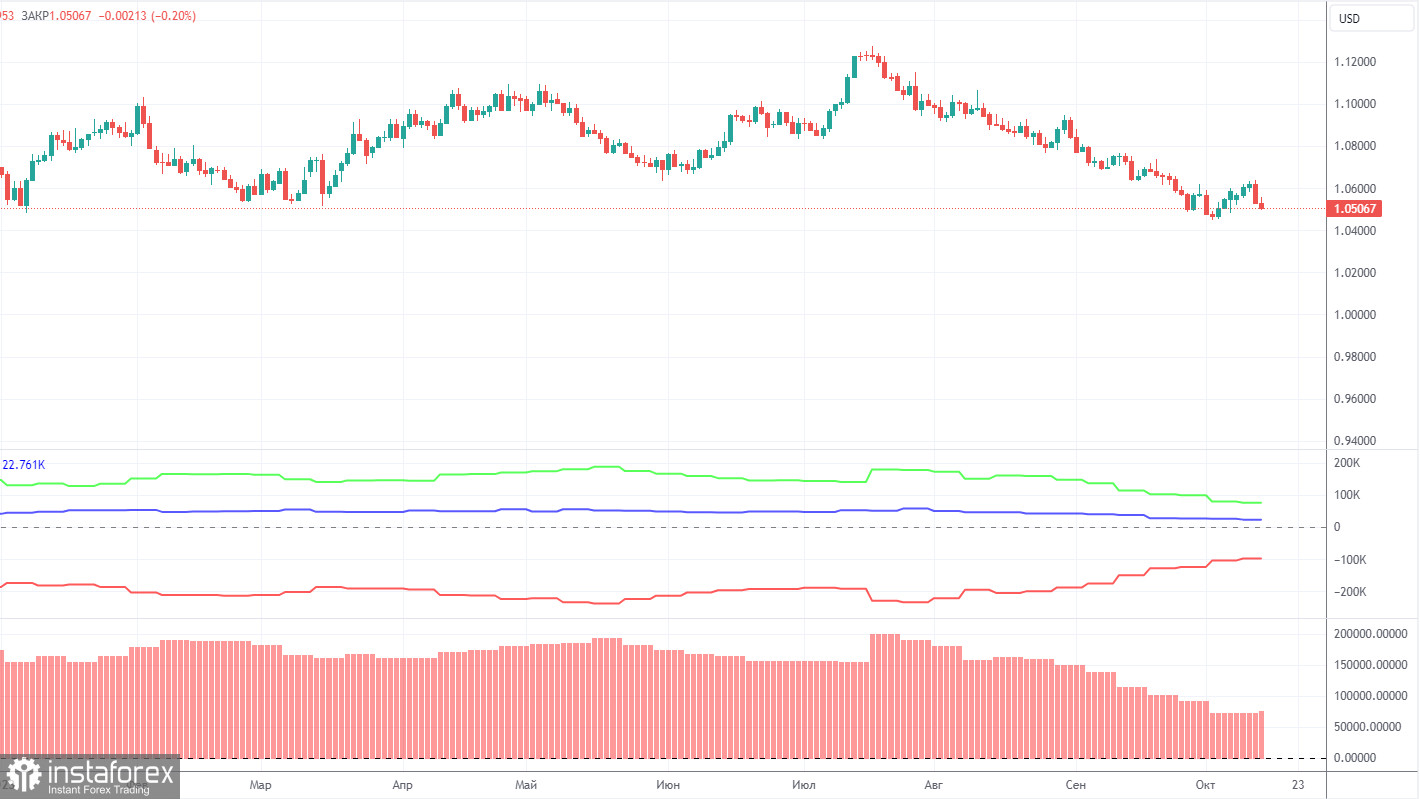
On Friday, a new COT report for October 17th was released. Over the past 12 months, the COT report data has been consistent with what's happening in the market. The net position of large traders (the second indicator) began to rise back in September 2022, roughly at the same time that the euro started to rise. In the first half of 2023, the net position hardly increased, but the euro remained relatively high during this period. Only in the last two months, we have seen a decline in the euro and a drop in the net position, which we've been waiting for a long time. Currently, the net position of non-commercial traders is still bullish and this trend is likely to lose momentum soon.
We have previously noted that the red and green lines have moved significantly apart from each other, which often precedes the end of a trend. This configuration persisted for over half a year, but ultimately, the lines have started moving closer to each other. Therefore, we still stick to the scenario that the upward trend is over. During the last reporting week, the number of long positions for the "non-commercial" group increased by 6,800, while the number of short positions fell by 100. Consequently, the net position increased by another 6,800 contracts. The number of BUY contracts is higher than the number of SELL contracts among non-commercial traders by 82,000, but the gap is narrowing. In principle, it is now evident even without COT reports that the euro is set to extend its weakness.
Analysis of EUR/USD 1H
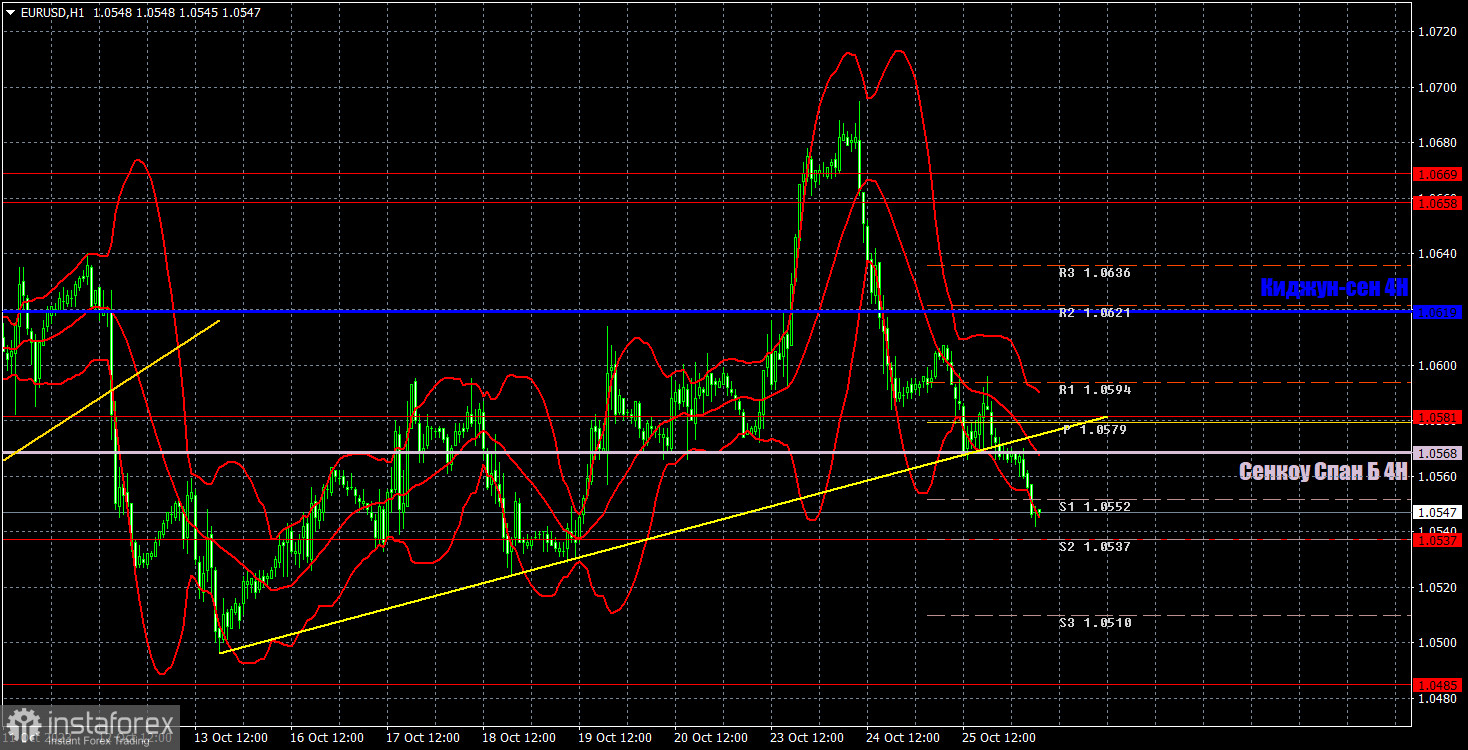
On the 1-hour chart, the pair exhibited two waves of the bullish correction, afterwards it drifted sharply lower and breached the trendline. Therefore, we expect the euro to resume its decline. There is also a possibility of entering consolidation, in which case we would see alternate movements that do not correlate well with fundamentals or macroeconomics. However, this is a backup scenario. For now, we expect the pair to fall towards the recent local low.
On October 26, we highlight the following levels for trading: 1.0269, 1.0340-1.0366, 1.0485, 1.0537, 1.0581, 1.0658-1.0669, 1.0768, 1.0806, 1.0868, 1.0935, as well as the Senkou Span B line (1.0568) and the Kijun-sen line (1.0619). The Ichimoku indicator lines can shift during the day, so this should be taken into account when identifying trading signals. There are also auxiliary support and resistance levels, but signals are not formed near them. Signals can be "bounces" and "breakouts" of extreme levels and lines. Don't forget to set a breakeven Stop Loss if the price has moved in the right direction by 15 pips. This will protect against potential losses if the signal turns out to be false.
The European Central Bank policy decision is due Thursday, and ECB President Christine Lagarde's news conference follows a half hour later. Lately, Lagarde has been delivering speeches quite frequently, but has yet to share any significant information. Today could be different. From the US, market participants will keep an eye on the quarterly GDP data and orders for durable goods. The market could become quite turbulent in the midday hours.
Description of the chart:
Support and resistance levels are thick red lines near which the trend may end. They do not provide trading signals;
The Kijun-sen and Senkou Span B lines are the lines of the Ichimoku indicator, plotted to the 1H timeframe from the 4H one. They provide trading signals;
Extreme levels are thin red lines from which the price bounced earlier. They provide trading signals;
Yellow lines are trend lines, trend channels, and any other technical patterns;
Indicator 1 on the COT charts is the net position size for each category of traders;
Indicator 2 on the COT charts is the net position size for the Non-commercial group.


