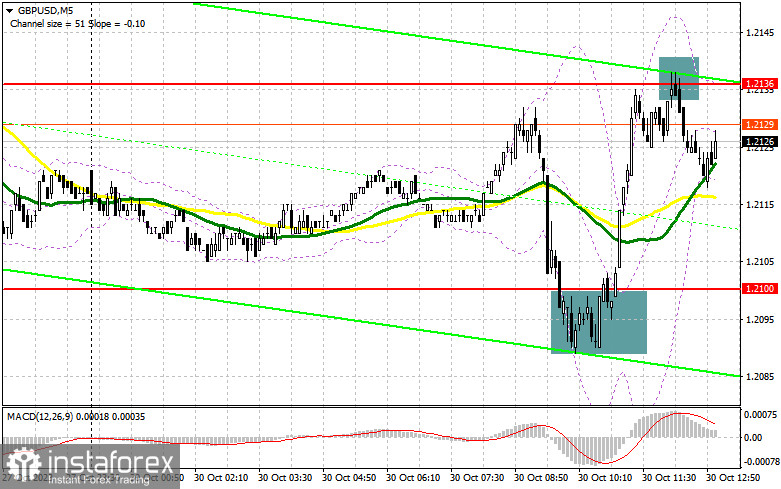
In my morning forecast, I turned your attention to the level of 1.2100 and recommended making decisions on entering the market with this level in focus. Let's look at the 5-minute chart and try to understand what happened there. The decline and a false breakout at this level produced an excellent entry point into long positions. During the European session, the instrument jumped by 35 pips. As of the afternoon, the technical picture had not been revised.

What is needed to open long positions on GBP/USD
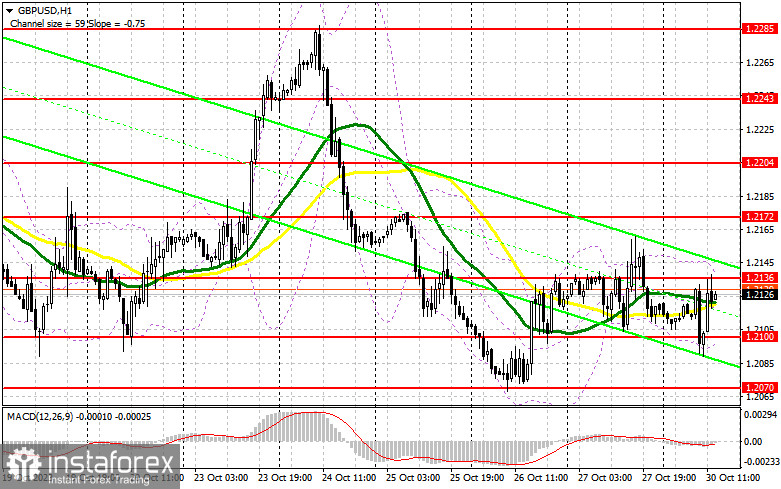
On the back of the empty economic calendar for the US, GBP may come under selling pressure again during the New York session, especially after the sellers managed to defend the level of 1.2136. For this reason, I will act as I did in the morning, only after the false breakout in the area of the nearest support 1.2100, similar to what was discussed above. The target will be the resistance of 1.2136, formed last Friday. A breakout and consolidation above this range will allow the buyers to return to the market, giving a signal to open long positions with an update of 1.2172. The highest target will be the area of 1.2204, where I will take profits. In a scenario where GBP/USD declines and there is no activity at 1.2100 from buyers in the afternoon, only a false breakout of a one-week low of 1.2070 will give a signal to open long positions. I plan to buy GBP/USD immediately on a dip from the low of 1.2038, bearing in mind a correction of 30-35 pips within the day.
What is needed to open short positions on GBP/USD
The sellers tried to break below 1.2100, but it turned out badly. In the afternoon, only a false breakout in the resistance area of 1.2136 will give a sell signal that could push the instrument to a low of 1.2100. A breakout and reverse test from the bottom up of this range will deal a more serious blow to the positions of the bulls, opening the way to 1.2070, which will enable a new bearish trend. A more distant target will be a low of 1.2038, where I will take profits. If GBP/USD grows and there is no activity at 1.2136 in the afternoon, (this level has already worked out once today), demand for the pound sterling will return, and the buyers will have a chance for a slight correction. In this case, I will postpone selling until a false breakout at 1.2172. If there is no downward movement even there, I will sell GBP/USD immediately on a rebound immediately from 1.2204, but only in anticipation of a downward correction by 30-35 points within the day.

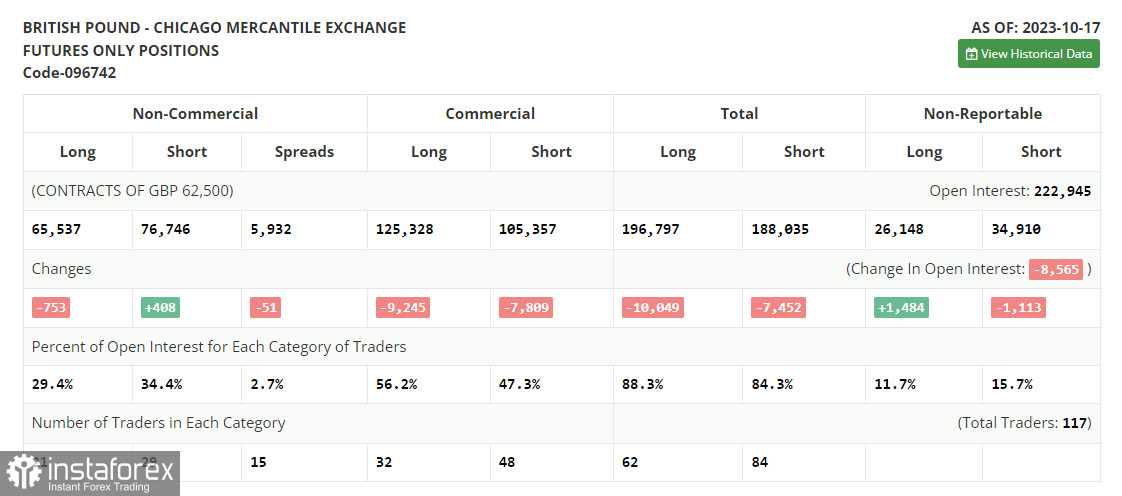
The COT (Commitment of Traders) report for October 17 logs a reduction in long positions and a slight increase in short ones. However, this did not greatly affect the balance of trading forces. Inflation data in the UK signaled that CPI growth rates would remain stable. Besides, Federal Reserve policymakers said that no one would vote for rate hikes in the near future. Such fundamentals weakened the position of the dollar and led to a rise in the pound sterling. Apparently, the trend of strengthening risky assets will continue in the near future until the meeting of the Federal Open Market Committee in November. The latest COT report reads that long non-commercial positions fell by 753 to 65,537 whereas short non-commercial positions increased by 408 to 76,746. As a result, the spread between long and short positions narrowed by 51. GBP/USD closed last trading week lower at 1.2179 versus 1.2284 a week ago.

Indicators' signals
Moving Averages
The instrument is trading at around the 30 and 50-day moving averages. It indicates that GBP/USD is trading sideways.
Note: The period and prices of the moving averages are considered by the analyst on the 1-hour chart and differ from the general definition of classic daily moving averages on the daily chart.
Bollinger Bands
In case GBP/USD goes up, the indicator's lower border at about 1.2100 will act as support.
Description of indicators
- Moving average (moving average, determines the current trend by smoothing out volatility and noise). Period 50. It is marked yellow on the chart.
- Moving average (moving average, determines the current trend by smoothing out volatility and noise). Period 30. It is marked green on the chart.
- MACD indicator (Moving Average Convergence/Divergence — convergence/divergence of moving averages) Quick EMA period 12. Slow EMA period to 26. SMA period 9
- Bollinger Bands (Bollinger Bands). Period 20
- Non-commercial speculative traders, such as individual traders, hedge funds, and large institutions that use the futures market for speculative purposes and meet certain requirements.
- Long non-commercial positions represent the total long open position of non-commercial traders.
- Short non-commercial positions represent the total short open position of non-commercial traders.
- Total non-commercial net position is the difference between short and long positions of non-commercial traders.


