


It seemed like the market needed to calm down and catch its breath, but surprisingly, the euro started to become active again, much like the beginning of the past week. Although the macroeconomic calendar is basically empty, and the fundamental background remains generally unchanged. Of course, one could attribute this to mounting Middle East tension, particularly on the Arabian Peninsula, but then oil and gold prices should have been rising. Yet, they were falling. So the reason behind the euro's growth lies in a somewhat different realm. It naturally concerns today's flash estimate of eurozone inflation. Not only are people already expecting a sharp slowdown in the rate of consumer price growth from 4.3% to 3.3%, but yesterday there were forecasts that it could drop even further to 3.1%. Understandably, after such figures, it is quite obvious that we shouldn't expect further interest rate hikes by the European Central Bank. It may even be time to talk about the imminent start of monetary easing in the eurozone. This will naturally weaken the euro's position. Often, ahead of such significant data or events, the market moves in the opposite direction of expectations. So, this is a traditional speculative game, the result of which is a more significant movement in the future. This is likely what awaits us today.
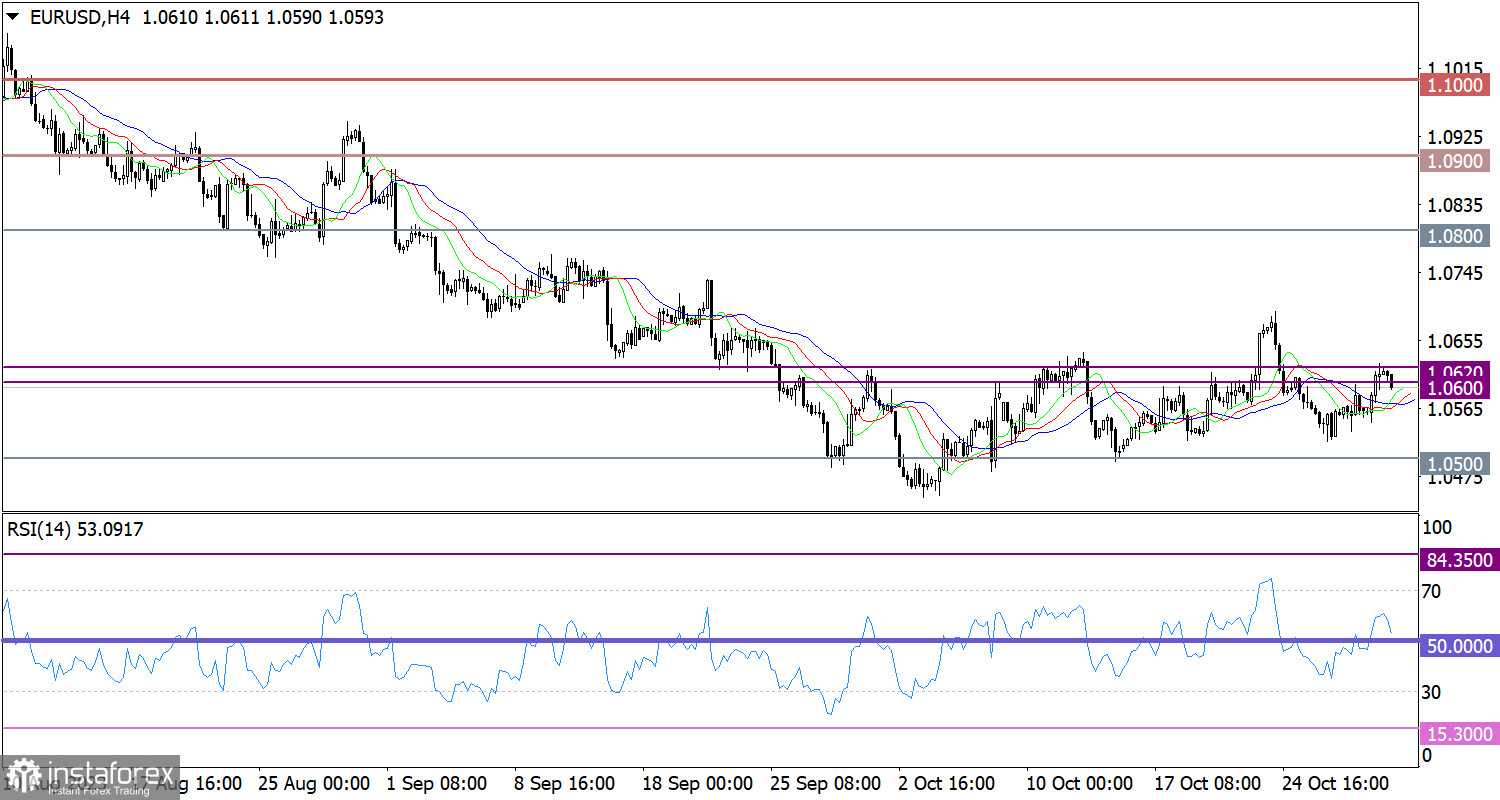
The EUR/USD pair has once again reached the resistance area of 1.0600/1.0620. However, traders failed to overcome this area. As a result, the volume of long positions decreased, leading to a rebound.
On the four-hour chart, the RSI technical indicator shows movement near the 50 mid line. This signal indicates a decline in buying volume.
On the same chart, the Alligator's MAs are headed upwards, but the signal is not stable.
Outlook
Currently, the price bounced from the resistance level, and in case it settles below 1.0600, the volume of short positions may increase. In this case, the price may fall towards the level of 1.0500.
In terms of the complex indicator analysis, we see that in the short-term period, technical indicators are pointing to a bounce. Meanwhile, in the intraday period, the indicators are reflecting an upward cycle since the pair reached the resistance level.


