Analysis of Wednesday trades:
EUR/USD 1H chart

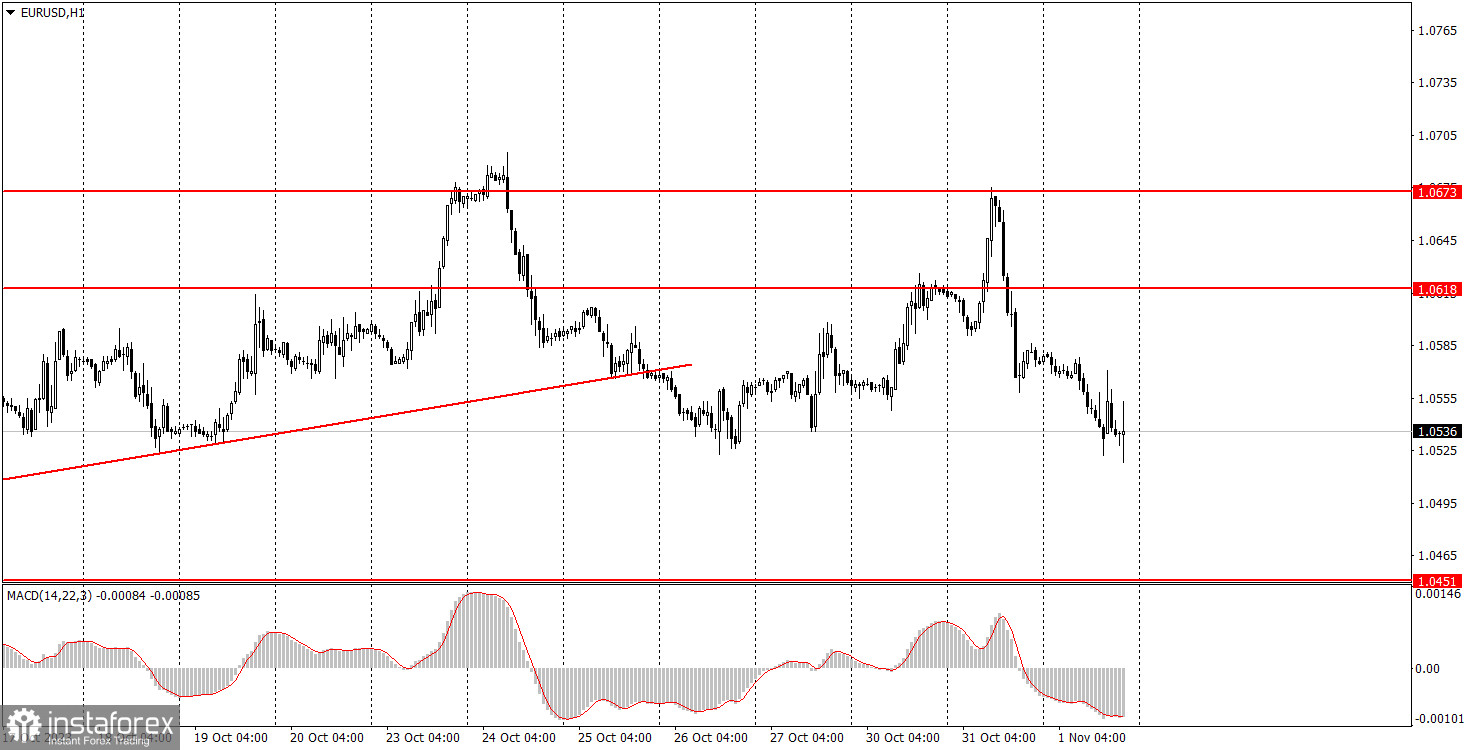
The EUR/USD currency pair continued to decline throughout Tuesday, although the specific reasons remain unclear. It should be noted that the pair has been undergoing a correction in recent weeks, albeit not consistently moving upward. However, when local peaks are updated, the movement is upward, albeit very weak. Therefore, the decline following the bounce from the 1.0673 level could easily be a pullback in the ongoing upward correction. At this point, a definitive conclusion about the resumption of a downward trend cannot be made. Especially since a significant amount of important economic data has already been published this week, and the Federal Reserve meeting concluded just an hour ago. In the remaining two days of the week, the number of significant events will be just as many if not more. Thus, by next Monday, the pair could be far from its current levels. Today's U.S. economic data was disappointing, but not severely so, which didn't prevent the dollar from strengthening over the course of the day.
EUR/USD 5M Chart

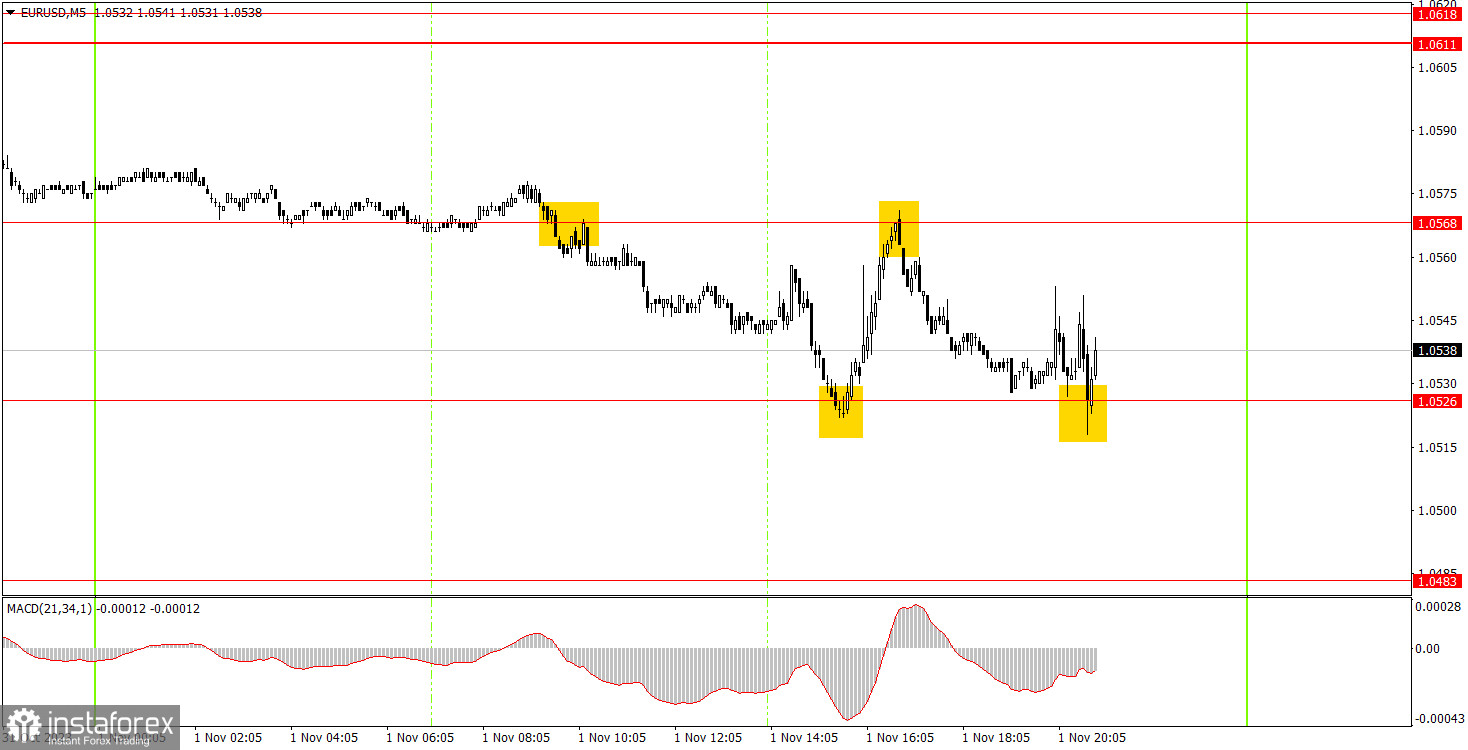
Several good trading signals were generated on the 5-minute time frame today. Volatility wasn't particularly high, but the price levels performed exceptionally well. The first sell signal appeared around the 1.0568 level, after which the price dropped to 1.0526 and bounced back. Sell positions should have been closed with about 20 points of profit, and long positions could have been opened. In the following couple of hours, the pair returned to 1.0586 and bounced back from there as well. Another 20 points of profit could have been gained, with short positions opened afterward. Over the next several hours, the pair returned to the 1.0526 level and performed as expected. This would have been a good point to exit the market entirely, especially with the upcoming Federal Reserve meeting. Overall, a total of 60 points could have been earned.
Trading ideas on Thursday:
On the hourly time frame, the pair has settled below the ascending trend line, indicating that a downward path is open. Although we expected the quotations to fall as early as the end of last week, the market is currently highly sensitive to fundamental and macroeconomic factors. Therefore, we wouldn't be surprised if another upward correction cycle begins. For the 5-minute time frame tomorrow, consider the following levels: 1.0391, 1.0433, 1.0451, 1.0483, 1.0526, 1.0568, 1.0611-1.0618, 1.0673, 1.0733, 1.0767-1.0781, 1.0835. When the price moves 15 points in the desired direction, a break-even Stop Loss can be set. On Thursday, final manufacturing PMI values will be published in the European Union and Germany. These are not crucial data points. In the United States, there will be jobless claims reports, which are also not highly significant. It's worth noting that the Bank of England will have a meeting, the results of which could also impact the euro.
Basic rules of a trading system:
1) Signal strength is determined by the time taken for its formation (either a bounce or level breach). A shorter formation time indicates a stronger signal.
2) If two or more trades around a certain level are initiated based on false signals, subsequent signals from that level should be disregarded.
3) In a flat market, any currency pair can produce multiple false signals or none at all. In any case, the flat trend is not the best condition for trading.
4) Trading activities are confined between the onset of the European session and mid-way through the U.S. session, post which all open trades should be manually closed.
5) On the 30-minute timeframe, trades based on MACD signals are only advisable amidst substantial volatility and an established trend, confirmed either by a trend line or trend channel.
6) If two levels lie closely together (ranging from 5 to 15 pips apart), they should be considered as a support or resistance zone.
How to read charts
Support and Resistance price levels can serve as targets when buying or selling. You can place Take Profit levels near them.
Red lines represent channels or trend lines, depicting the current market trend and indicating the preferable trading direction.
The MACD(14,22,3) indicator, encompassing both the histogram and signal line, acts as an auxiliary tool and can also be used as a signal source.
Significant speeches and reports (always noted in the news calendar) can profoundly influence the price dynamics. Hence, trading during their release calls for heightened caution. It may be reasonable to exit the market to prevent abrupt price reversals against the prevailing trend.
Beginning traders should always remember that not every trade will yield profit. Establishing a clear strategy coupled with sound money management is the cornerstone of sustained trading success.


