


Analysis of EUR/USD 5M
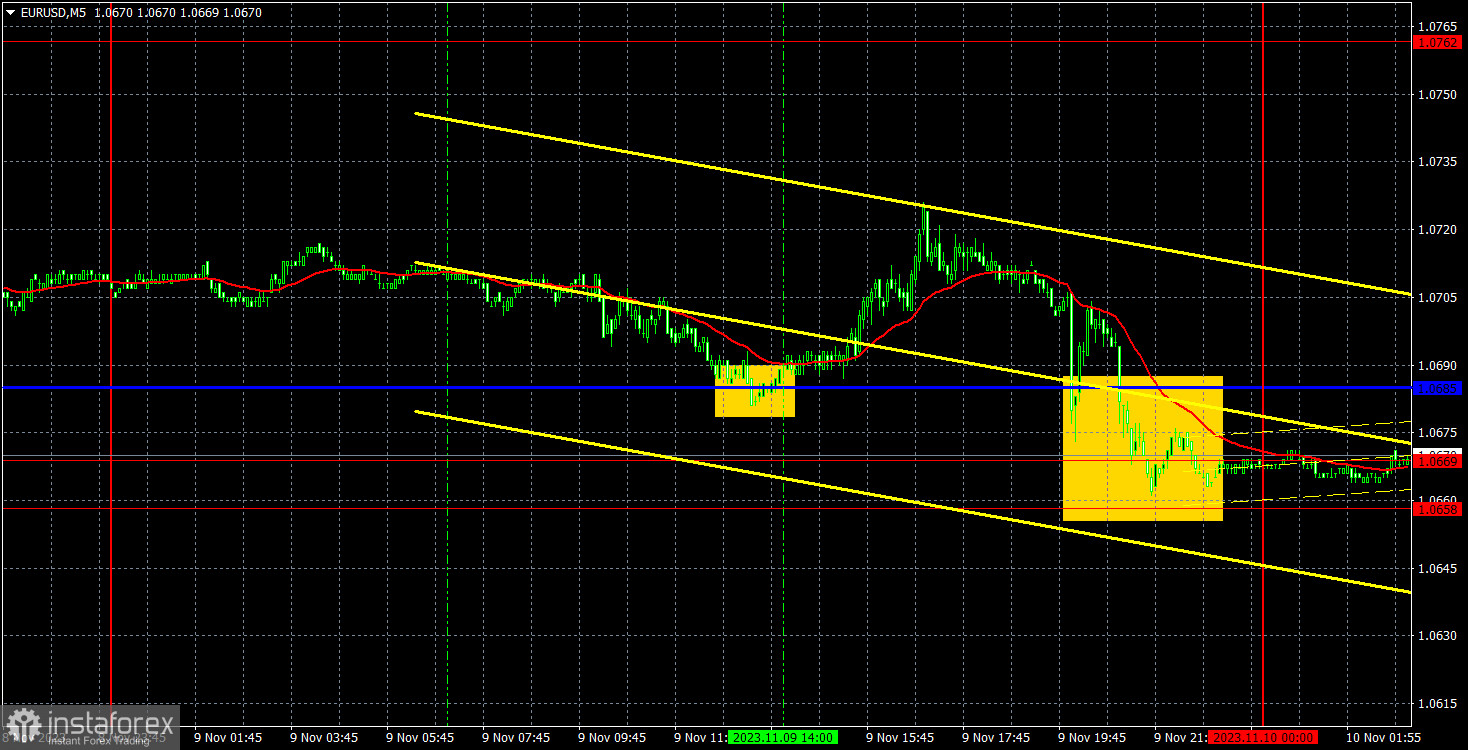
EUR/USD edged down on Thursday. It started to fall in the morning, but upon reaching the critical line, there was a small upward retracement, which, however, did not prevent the pair from falling once again a little later on. Thus, at the end of the day, the price settled below the Kijun-sen line, and fell towards the Senkou Span B line.
From Thursday's macroeconomic background, we can only highlight the US unemployment claims report. However, this report failed to impress the market, so there was no reaction to it. A bit later, Federal Reserve Chairman Jerome Powell delivered a speech, and this time, he was straightforward, which could have strengthened the US currency, as he said that the US central bank will not hesitate to tighten more if needed.
In general, only one trading signal was generated on Thursday. Before the opening of the US trading session, the price bounced off the critical Kijun-sen line and managed to rise by about 25 pips. However, traders could not make a profit out of this trade, as the price subsequently returned to the Kijun-sen line and remained in the range of lines 1.0658-1.0685 until the end of the day.
COT report:
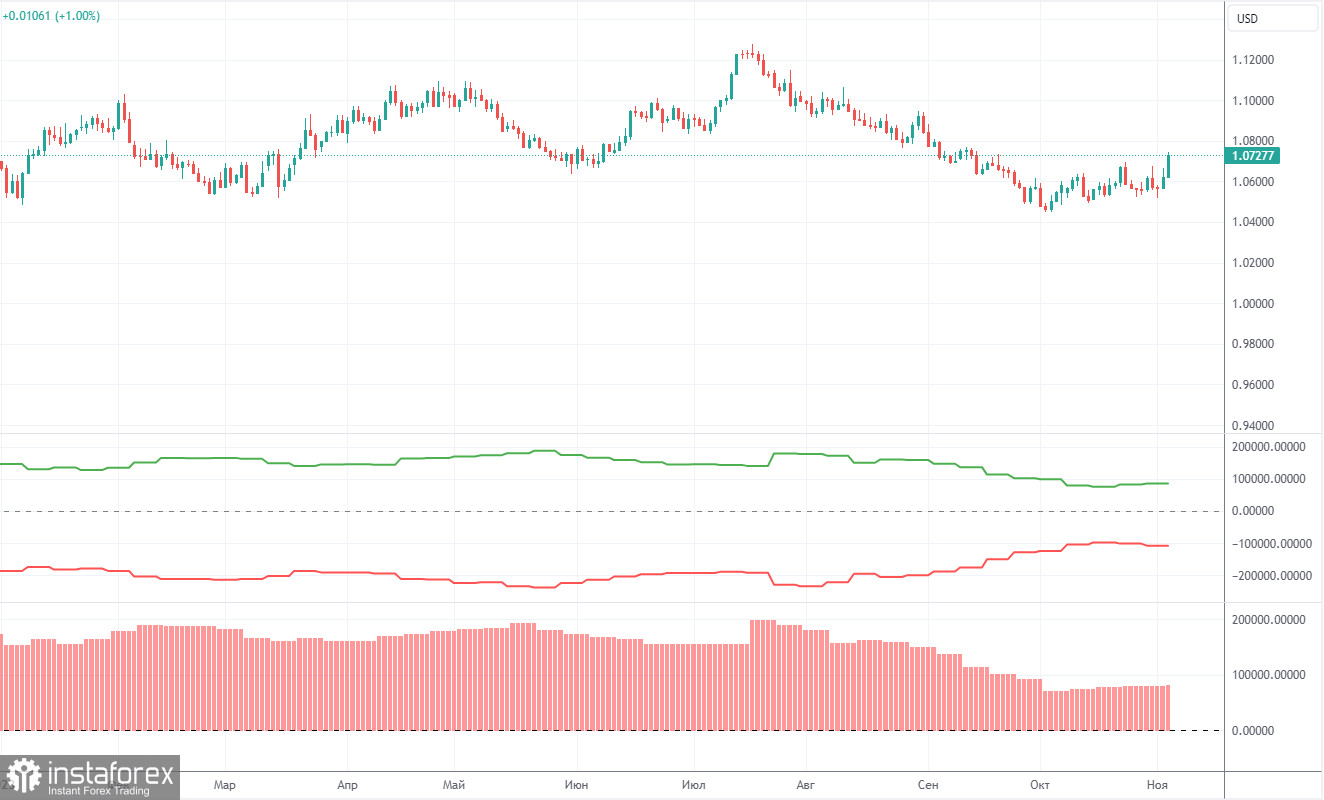
On Friday, a new COT report for October 31st was released. Over the past 12 months, the COT report data has been consistent with what's happening in the market. The net position of large traders (the second indicator) began to rise back in September 2022, roughly at the same time that the euro started to rise. In the first half of 2023, the net position hardly increased, but the euro remained relatively high during this period. Only in the last three months, we have seen a decline in the euro and a drop in the net position, as we anticipated. Currently, the net position of non-commercial traders is still bullish and this trend is likely to lose momentum soon.
We have previously noted that the red and green lines have moved significantly apart from each other, which often precedes the end of a trend. This configuration persisted for over half a year, but ultimately, the lines have started moving closer to each other. Therefore, we still stick to the scenario that the upward trend is over. During the last reporting week, the number of long positions for the "non-commercial" group decreased by 4,700, while the number of short positions fell by 4,800. Consequently, the net position remained mostly unchanged. The number of BUY contracts is still higher than the number of SELL contracts among non-commercial traders by 82,000, but the gap is narrowing. In principle, it is now evident even without COT reports that the euro is set to extend its weakness. However, the corrective phase has not yet ended.
Analysis of EUR/USD 1H
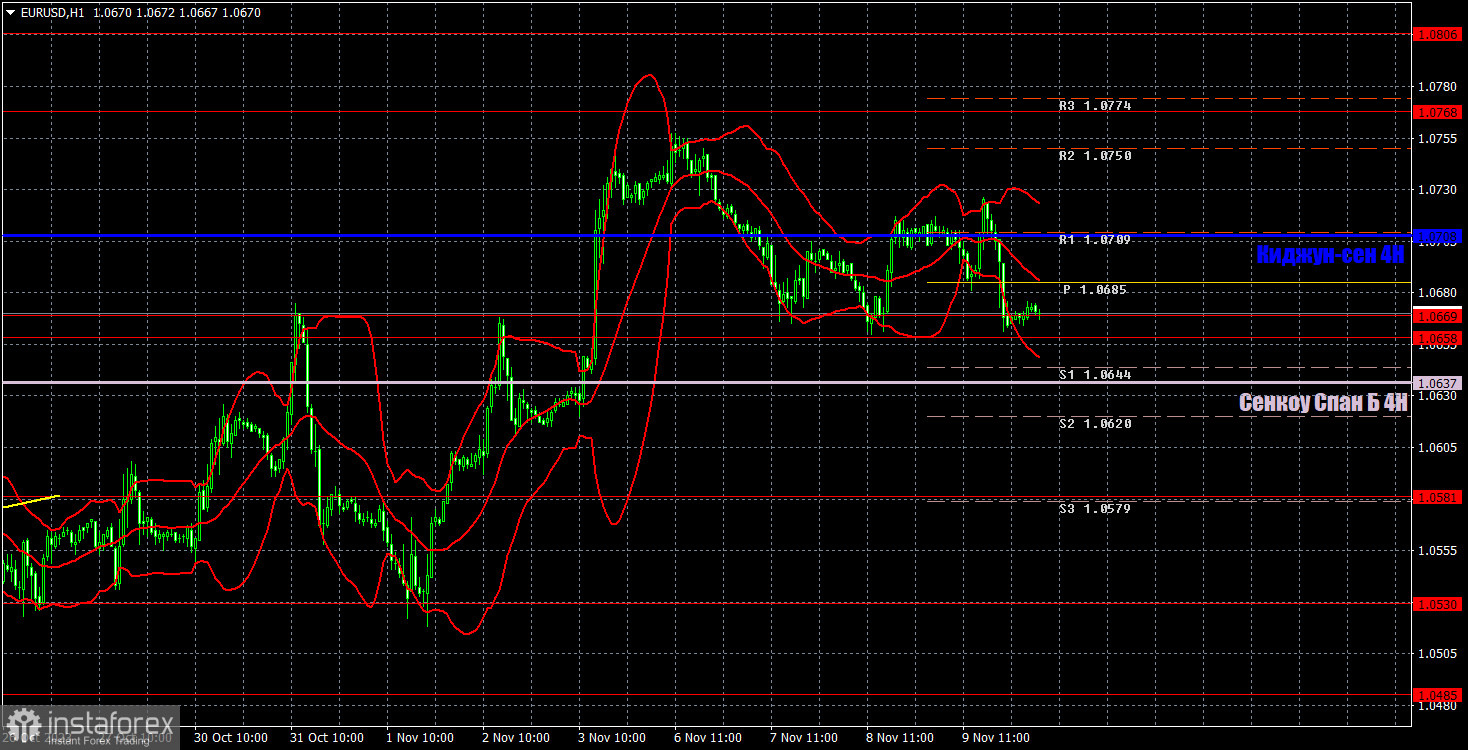
On the 1-hour chart, the pair exhibited four corrective phases, which means that it may have finally ended. The pair started to fall on Monday and Tuesday, and now it needs to breach the Senkou Span B and Kijun-sen lines to drop to 1.0530. This week's macroeconomic and fundamental background has been weak, so the pair is moving erratically and also seemingly, in a reluctant way. Nevertheless, we still believe that the dollar will rise.
On November 10, we highlight the following levels for trading: 1.0340-1.0366, 1,0485, 1,0530, 1,0581, 1,0658-1.0669, 1,0768, 1,0806, 1,0868, 1,0935, 1,1043, as well as the Senkou Span B (1.0637) and Kijun-sen (1.0708). The Ichimoku indicator lines can shift during the day, so this should be taken into account when identifying trading signals. There are also auxiliary support and resistance levels, but signals are not formed near them. Signals can be "bounces" and "breakouts" of extreme levels and lines. Don't forget to set a breakeven Stop Loss if the price has moved in the right direction by 15 pips. This will protect against potential losses if the signal turns out to be false.
On Friday, European Central Bank President Christine Lagarde will speak, but we don't expect her to reveal any important information at the moment. From the US, traders may look to the release of the consumer sentiment report from the University of Michigan. Most likely, we can expect another day of chaotic movements with low volatility.
Description of the chart:
Support and resistance levels are thick red lines near which the trend may end. They do not provide trading signals;
The Kijun-sen and Senkou Span B lines are the lines of the Ichimoku indicator, plotted to the 1H timeframe from the 4H one. They provide trading signals;
Extreme levels are thin red lines from which the price bounced earlier. They provide trading signals;
Yellow lines are trend lines, trend channels, and any other technical patterns;
Indicator 1 on the COT charts is the net position size for each category of traders;
Indicator 2 on the COT charts is the net position size for the Non-commercial group.


