


Details of the Economic Calendar on November 10
Industrial production data in the UK remained at the level of 1.5% despite expectations of a decline. However, the previous indicator was revised in favor of growth, from 1.3% to 1.5%, and the actual figures came in at 1.5% instead of 1.1% (YoY).
Analysis of Trading Charts from November 10
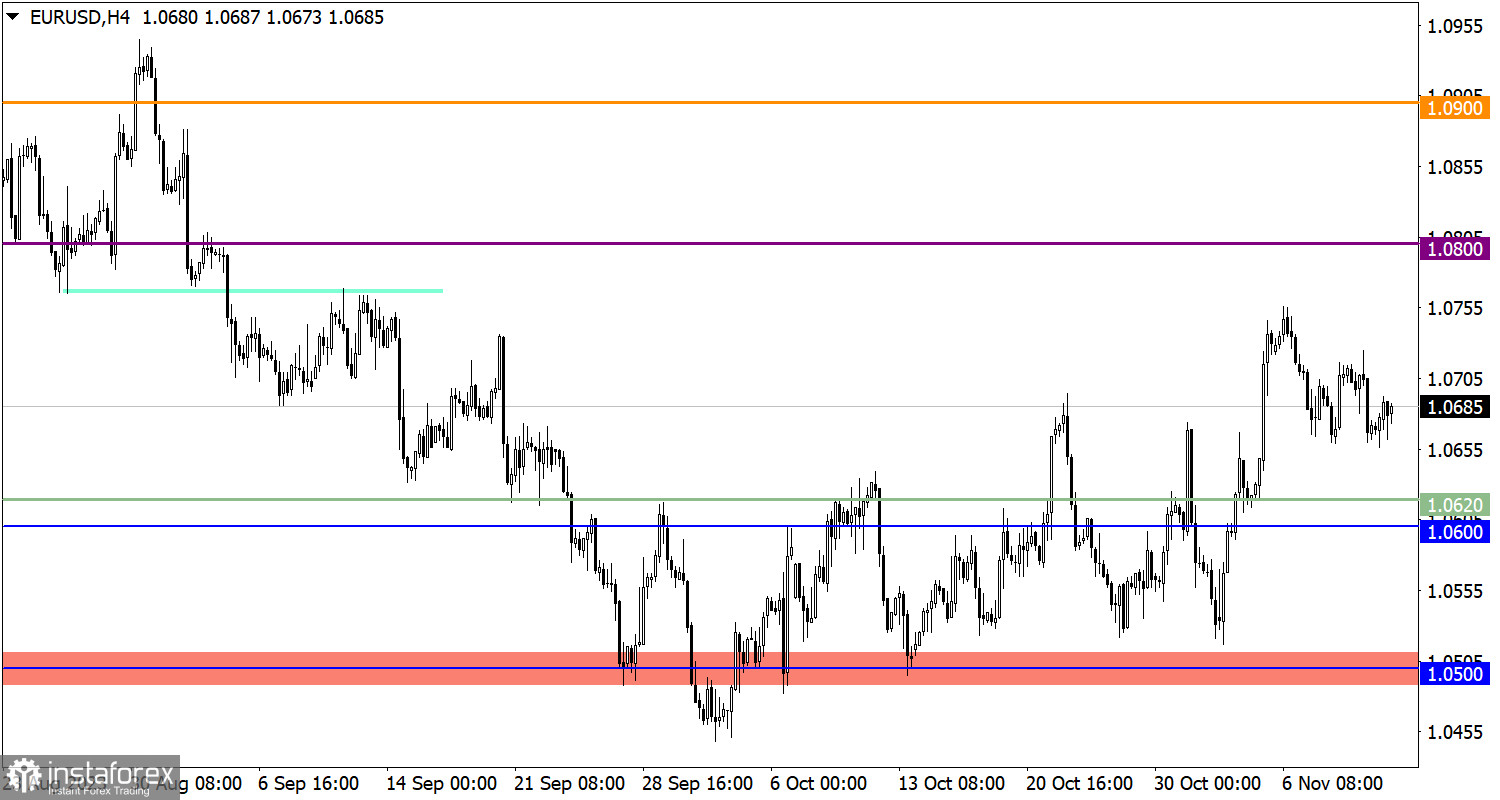
The EUR/USD currency pair slowed its decline and did not reach the 1.0650 mark. In fact, starting from the middle of last week, the quote has been in a conditional sideways range.
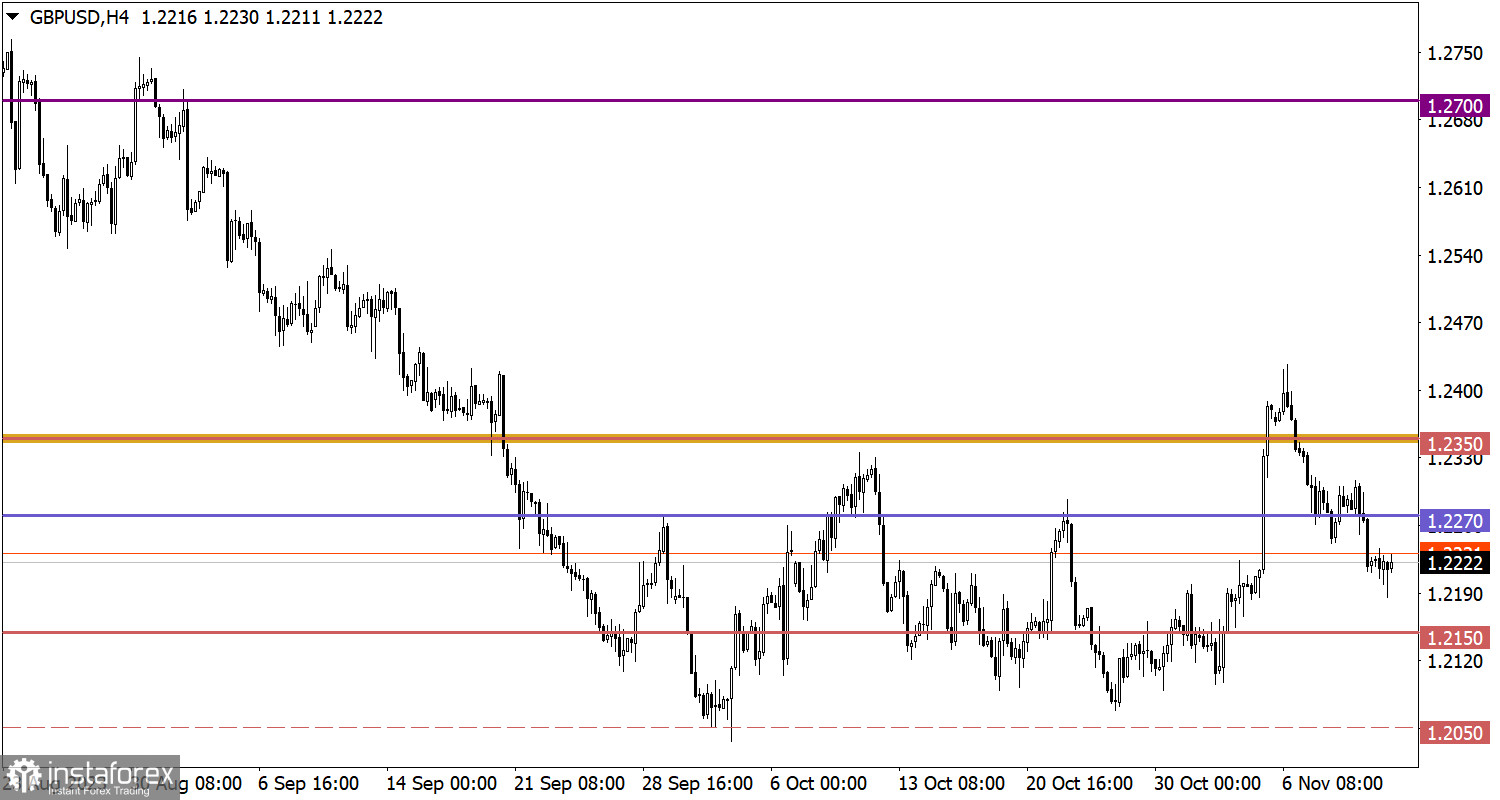
As for the GBP/USD pair, it temporarily dropped below the level of 1.2200, but then there was a reduction in the volume of short positions. As a result, the week ended with the formation of a two-digit doji candle, indicating a slowdown in the downward trend.
Economic Calendar for November 13
Monday, as usual, is accompanied by an empty macroeconomic calendar. No releases of important statistical data are expected in the European Union, the United Kingdom, and the United States.
In connection with this, investors and traders are likely to rely on the incoming news flow to make decisions in the market.
EUR/USD Trading Plan for November 13
In this situation, we have two key levels: the first is at 1.0650, which is considered in a downward scenario, and the second is at 1.0750. A breakout of the 1.0750 mark would indicate a continuation of the upward cycle.
GBP/USD Trading Plan for November 13
For further depreciation of the pound sterling, it is necessary for the price to stay below the level of 1.2200. In this case, we can expect a movement towards 1.2150.
As for the upward scenario, it is considered as a partial recovery of the value of the pound, taking into account the local oversold condition in short-term time periods. The level of 1.2200 can serve as a variable support, and if the price holds above this level, we can expect a gradual recovery of the quote above the value of 1.2270.
What's on the charts
The candlestick chart type is white and black graphic rectangles with lines above and below. With a detailed analysis of each individual candle, you can see its characteristics relative to a particular time frame: opening price, closing price, intraday high and low.
Horizontal levels are price coordinates, relative to which a price may stop or reverse its trajectory. In the market, these levels are called support and resistance.
Circles and rectangles are highlighted examples where the price reversed in history. This color highlighting indicates horizontal lines that may put pressure on the asset's price in the future.
The up/down arrows are landmarks of the possible price direction in the future.


