


GOLD
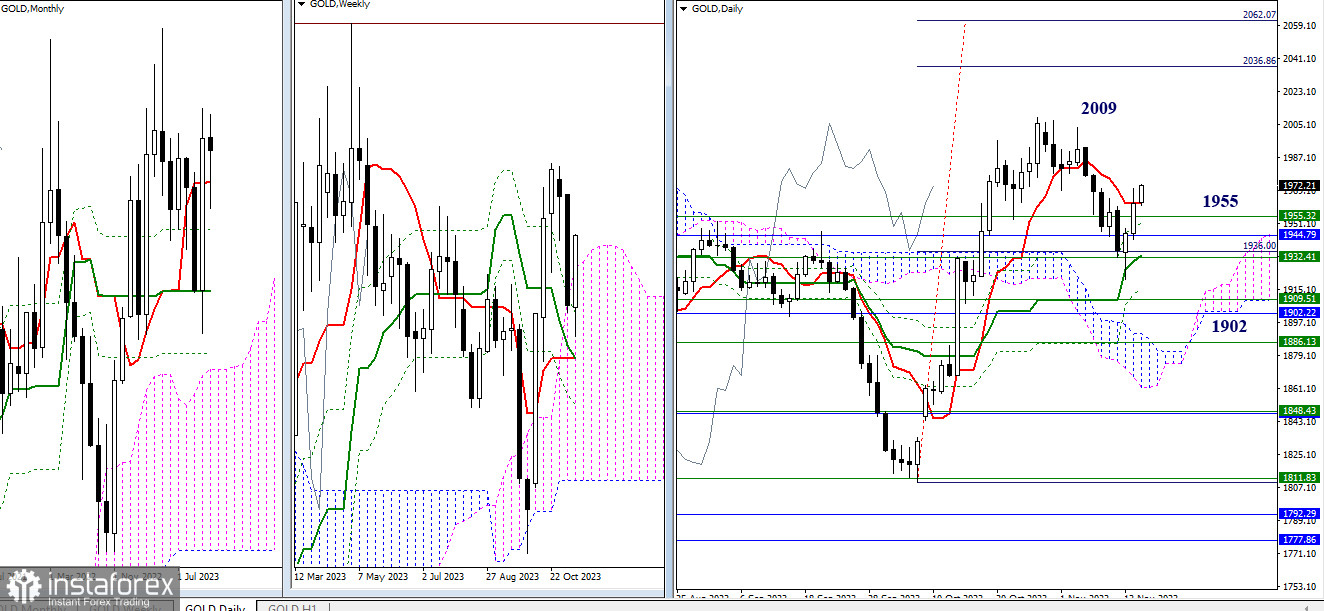
After testing the support of the monthly medium-term trend and the weekly cloud, gold actively sought to restore bullish positions throughout October. Much was achieved, but with the beginning of November, bearish players took the initiative and started developing the decline.
Some levels, previously surpassed by bullish players, now serve as the nearest supports. Interaction with the zone of 1926 – 1955 (daily medium-term trend + monthly short-term trend + upper boundary of the weekly cloud) led to the formation of a rebound. The daily rebound received confirmation, so the bulls' task now, based on the daily result, is to implement a rebound on the weekly timeframe. In case of success, further strengthening of bullish sentiments will be oriented towards exiting the correction zone (2009), with subsequent execution of the bullish target for breaking the daily Ichimoku cloud (2037 – 2062).
Failure of bullish players will put the opponent in charge of eliminating the daily golden cross, the final level of which is currently located at 1916, as well as returning under the support of the monthly short-term trend (1902), all of which will contribute to consolidation in the weekly cloud. By completing these tasks, bears will aim to neutralize all the achievements of their opponent in October.
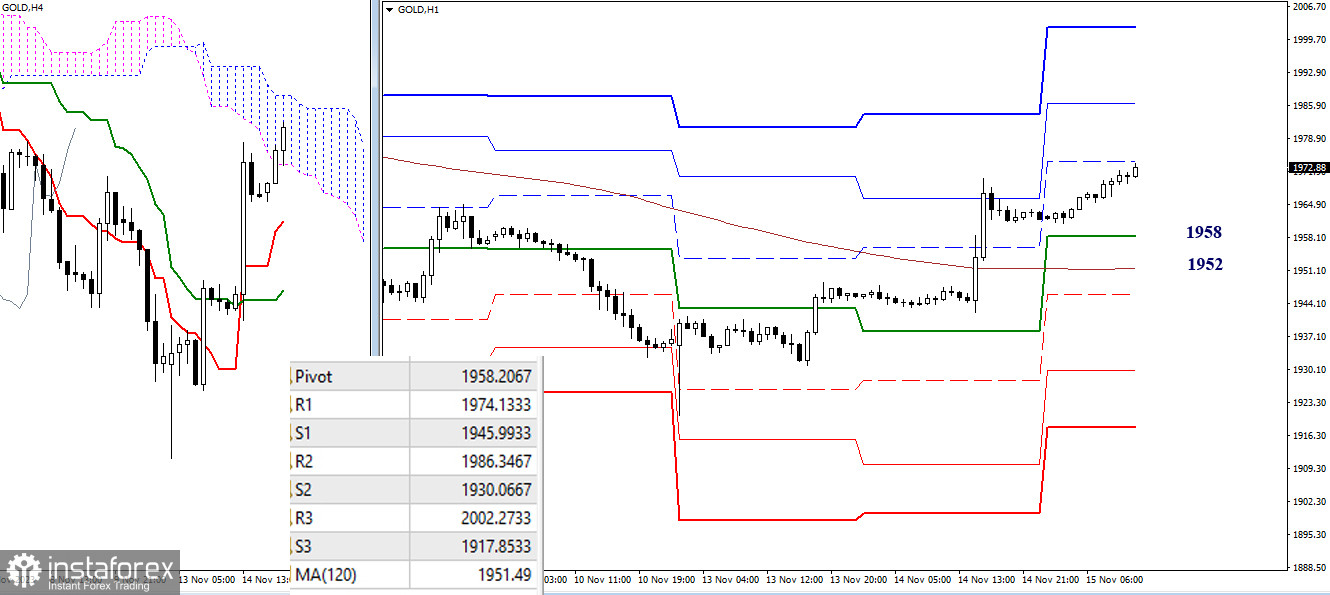
Earlier, the formation of a daily rebound allowed bulls to securely gain an advantage on lower timeframes. Now they are close to overcoming the resistance of the cloud on H4, with the result being a new bullish target—the target for breaking the H4 cloud. In addition, for the current development of the situation within the day, the resistances of classic pivot points act as benchmarks. Currently, R1 (1974) is being tested, followed by R2 (1986) and R3 (2002). The key levels in the current situation serve as supports. Today, they are ready to defend bullish interests and advantages in the area of 1958 (central pivot point of the day) – 1952 (weekly long-term trend).
The technical analysis of the situation uses:
Higher timeframes - Ichimoku Kinko Hyo (9.26.52) + Fibo Kijun levels
H1 - Pivot Points (classic) + Moving Average 120 (weekly long-term trend)


