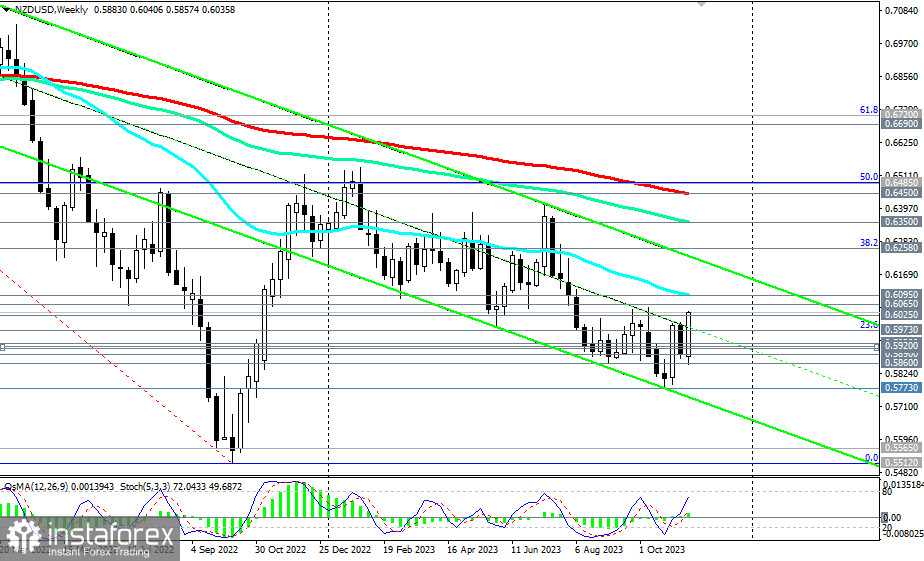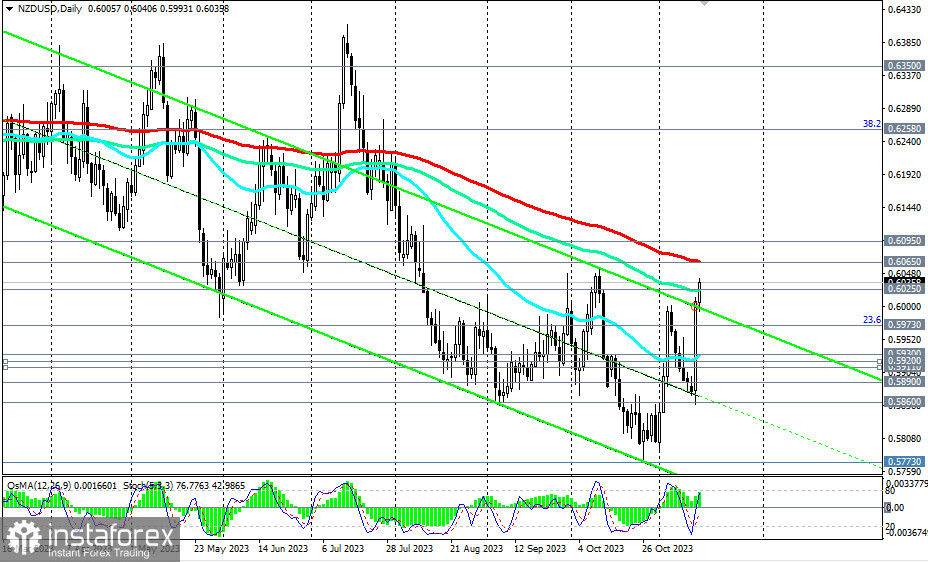
NZD/USD rose by 2.3% on Tuesday amid a sharp weakening of the U.S. dollar following the disappointing inflation data in the United States. The pair rebounded from a two-week low at 0.5858 and reached a local high since October 13 at 0.6013.
From the opening of today's trading day, the NZD/USD pair is again growing, reaching 0.6036 as of this writing. It is evident that the price is striving for the key resistance level of 0.6065 (200 EMA on the daily chart), which separates the medium-term bearish market of the pair from the bullish one.

To enter the bullish zone of the medium-term market, the price will need to overcome two more important resistance levels: 0.6095 (50 EMA on the weekly chart) and 0.6100.
For now, despite yesterday's and today's growth, NZD/USD is trading in the bearish market zone: medium-term—below resistance levels of 0.6095, 0.6065, and long-term—below resistance levels of 0.6450 (200 EMA on the weekly chart) and 0.6485 (50% Fibonacci level in the pair's downward wave from 0.7465 in February 2021 to 0.5510 reached in October 2022).
In the main scenario, we expect a resumption of the decline. A signal for this could already be a breakdown of the support level of 0.6025 (144 EMA on the daily chart). A break of today's low at 0.5993 will confirm our assumption.
In the alternative scenario, the corrective rise of NZD/USD will continue up to the resistance levels of 0.6065 and 0.6095, as noted above. However, only a breakout of the key resistance level of 0.6450 and the level of 0.6485 will take the pair into the long-term bullish market zone.
Short positions remain preferable for now.
Support levels: 0.6025, 0.6000, 0.5973, 0.5930, 0.5920, 0.5911, 0.5890, 0.5860, 0.5775
Resistance levels: 0.6065, 0.6095, 0.6100, 0.6200, 0.6258, 0.6300, 0.6350, 0.6400, 0.6450, 0.6485, 0.6500


