


Analysis of macroeconomic reports:
For Monday, the lineup of macroeconomic events is practically barren. We can only highlight the producer price index in Germany, which doesn't have a chance of influencing market sentiment. So, let's just pretend that there won't be any macroeconomic events at all.
Analysis of fundamental events:
From Monday's fundamental events, only a speech by Bank of England Governor Andrew Bailey stands out. In our opinion, this could be interesting because the UK just released its latest inflation report, and Bailey may comment on it. However, his rhetoric is likely to be more on the dovish side, as inflation slowed down to 4.6% in October, which is already below Bailey's own forecast, who promised 5% by New Year's. Therefore, the only thing he can say is the unnecessary need for another rate hike. Such information is unlikely to support the British pound.
General conclusion:
On Monday, we will only highlight Bailey's speech, but it is far from certain that he will touch on the topic of monetary policy and inflation. Speeches and their topics vary. There are no scheduled macroeconomic events. Therefore, if Bailey announces anything important, one can expect a market reaction. If not, it's unlikely.
Basic rules of a trading system:
1) Signal strength is determined by the time taken for its formation (either a bounce or level breach). A shorter formation time indicates a stronger signal.
2) If two or more trades around a certain level are initiated based on false signals, subsequent signals from that level should be disregarded.
3) In a flat market, any currency pair can produce multiple false signals or none at all. In any case, the flat trend is not the best condition for trading.
4) Trading activities are confined between the onset of the European session and mid-way through the U.S. session, post which all open trades should be manually closed.
5) On the 30-minute timeframe, trades based on MACD signals are only advisable amidst substantial volatility and an established trend, confirmed either by a trend line or trend channel.
6) If two levels lie closely together (ranging from 5 to 15 pips apart), they should be considered as a support or resistance zone.
How to read charts:
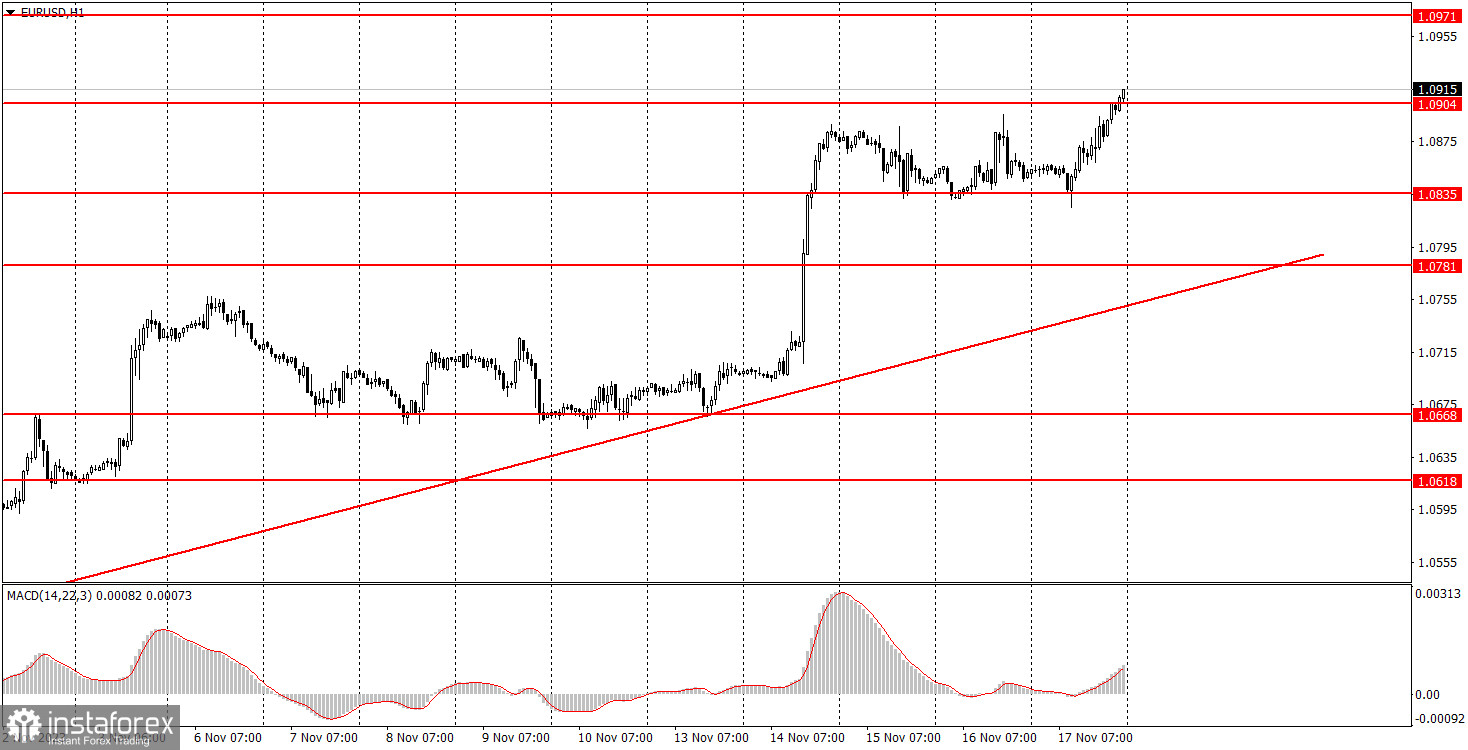
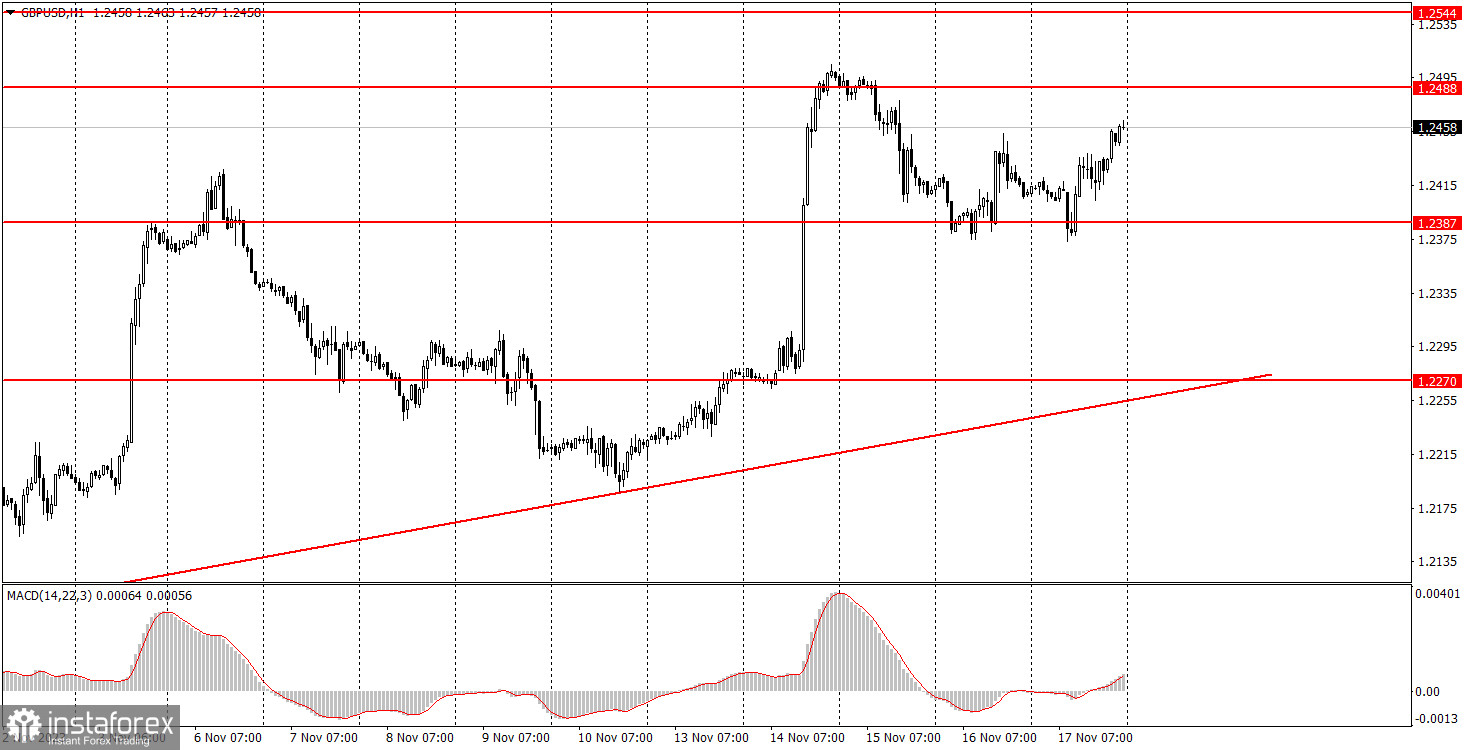
Support and Resistance price levels can serve as targets when buying or selling. You can place Take Profit levels near them.
Red lines represent channels or trend lines, depicting the current market trend and indicating the preferable trading direction.
The MACD(14,22,3) indicator, encompassing both the histogram and signal line, acts as an auxiliary tool and can also be used as a signal source.
Significant speeches and reports (always noted in the news calendar) can profoundly influence the price dynamics. Hence, trading during their release calls for heightened caution. It may be reasonable to exit the market to prevent abrupt price reversals against the prevailing trend.
Beginning traders should always remember that not every trade will yield profit. Establishing a clear strategy coupled with sound money management is the cornerstone of sustained trading success.


