


Analysis of Wednesday trades:
EUR/USD 1H chart
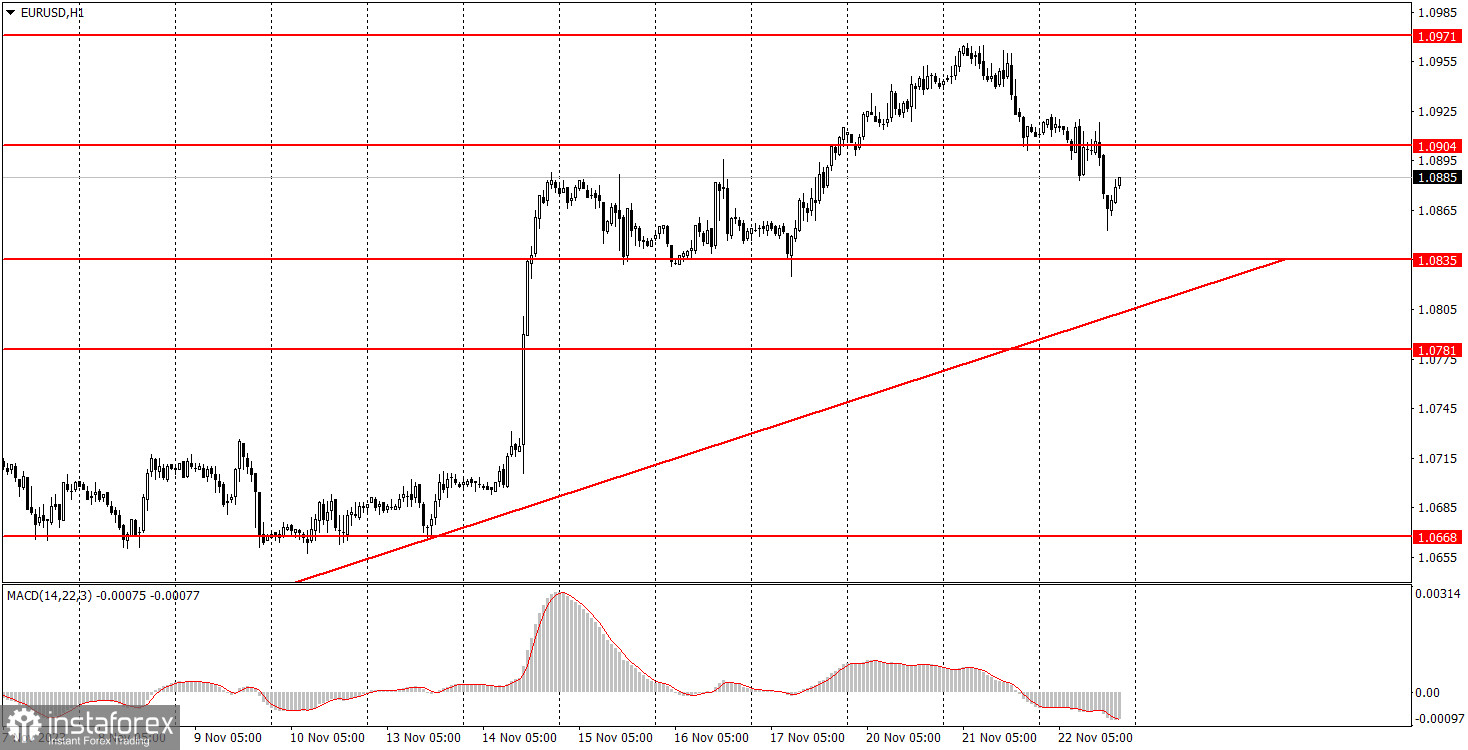
During Wednesday's trading, the EUR/USD currency pair extended its downward trajectory, a trend initiated the previous day. Echoing Tuesday's pattern, the decline was modest, yet marked the second consecutive day of falling prices. Should this trend persist for another day, the ascending trend line is likely to be fully engaged. The future direction hinges on whether this line is crossed. The outlook suggests a continued depreciation of the pair regardless of most developments. The Euro remains heavily overbought, with no substantial grounds for a medium-term appreciation. Interestingly, today's trading saw investors overlook lackluster data from the U.S. and pivot towards buying the dollar.
Today's macroeconomic releases were all from the U.S. The number of unemployment benefit claims came in below forecasts, contrasting with the durable goods orders report, which also fell short of expectations but carried more weight. While the former was a positive for the dollar, the latter was decidedly negative, much worse than market expectations. Consequently, today's market behavior in favoring the U.S. currency might be seen as somewhat unjustified.
EUR/USD 5M chart
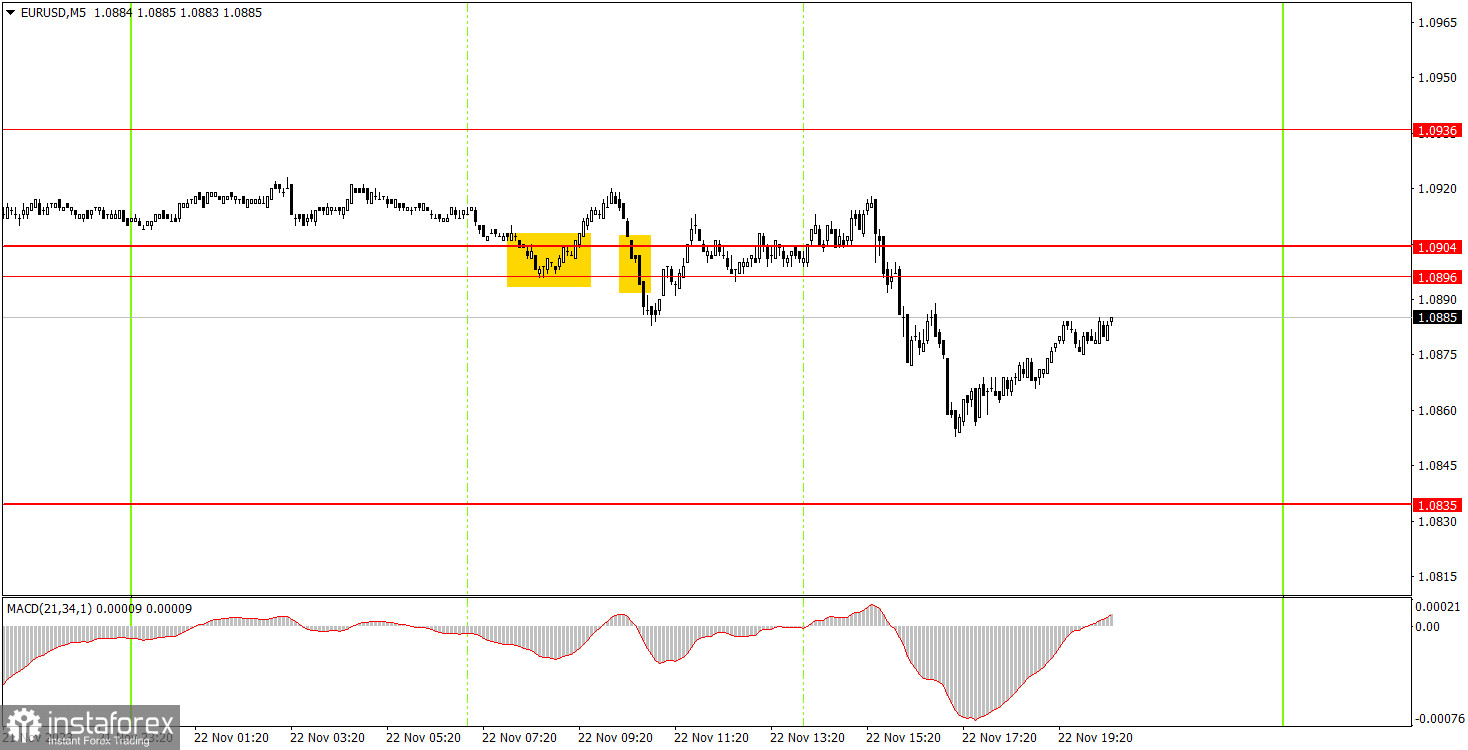
On the 5-minute timeframe today, numerous signals were generated around the 1.0896-1.0904 area. Regrettably, all but the last proved false. During the European trading session, the pair was flat, which explains the emergence of these false signals. Novice traders could only realistically engage the first two, both of which failed to move even 15 points in the correct direction, leading to minor losses on these trades.
Trading ideas for Thursday:
On the hourly timeframe, the pair continues a corrective trend. This trend, reinvigorated by last week's U.S. inflation report, remains a correction despite the pair's sharp rally. Therefore, the anticipation is for this correction to conclude and the downward trend to resume. Currently, an ascending trend line is present, which will help determine the end of the correction. For Thursday's trading on the 5-minute timeframe, the levels to watch are 1.0568, 1.0611-1.0618, 1.0668, 1.0733, 1.0767-1.0781, 1.0835, 1.0896-1.0904, 1.0936, 1.0971-1.0981, 1.1011, 1.1043, and 1.1091. After a 15-point move in the right direction, setting a stop-loss at break-even is advisable. In Germany and the Eurozone, the service and manufacturing PMI data for November will be released on Thursday. Significant improvement in these indicators is not anticipated, so they are unlikely to trigger further strengthening of the Euro.
Basic rules of a trading system:
1) Signal strength is determined by the time taken for its formation (either a bounce or level breach). A shorter formation time indicates a stronger signal.
2) If two or more trades around a certain level are initiated based on false signals, subsequent signals from that level should be disregarded.
3) In a flat market, any currency pair can produce multiple false signals or none at all. In any case, the flat trend is not the best condition for trading.
4) Trading activities are confined between the onset of the European session and mid-way through the U.S. session, post which all open trades should be manually closed.
5) On the 30-minute timeframe, trades based on MACD signals are only advisable amidst substantial volatility and an established trend, confirmed either by a trend line or trend channel.
6) If two levels lie closely together (ranging from 5 to 15 pips apart), they should be considered as a support or resistance zone.
How to read charts:
Support and Resistance price levels can serve as targets when buying or selling. You can place Take Profit levels near them.
Red lines represent channels or trend lines, depicting the current market trend and indicating the preferable trading direction.
The MACD(14,22,3) indicator, encompassing both the histogram and signal line, acts as an auxiliary tool and can also be used as a signal source.
Significant speeches and reports (always noted in the news calendar) can profoundly influence the price dynamics. Hence, trading during their release calls for heightened caution. It may be reasonable to exit the market to prevent abrupt price reversals against the prevailing trend.
Beginning traders should always remember that not every trade will yield profit. Establishing a clear strategy coupled with sound money management is the cornerstone of sustained trading success.


