


Analysis of EUR/USD 5M
EUR/USD continued to trade higher on Tuesday. We have been talking about the same thing almost every day - there is no reason for the euro to rise, but the euro (along with the pound) continues to grow. Moreover, if earlier it could be said that the dollar is falling due to U.S. economic data, as the latest important reports were weak, in the last three days, the U.S. data have not been weak. And the European Union hasn't given us good news either. Therefore, the pair is growing on pure momentum or pure speculation. In simpler terms, the market buys the pair because it is rising. And it doesn't matter whether there are grounds for this or not.
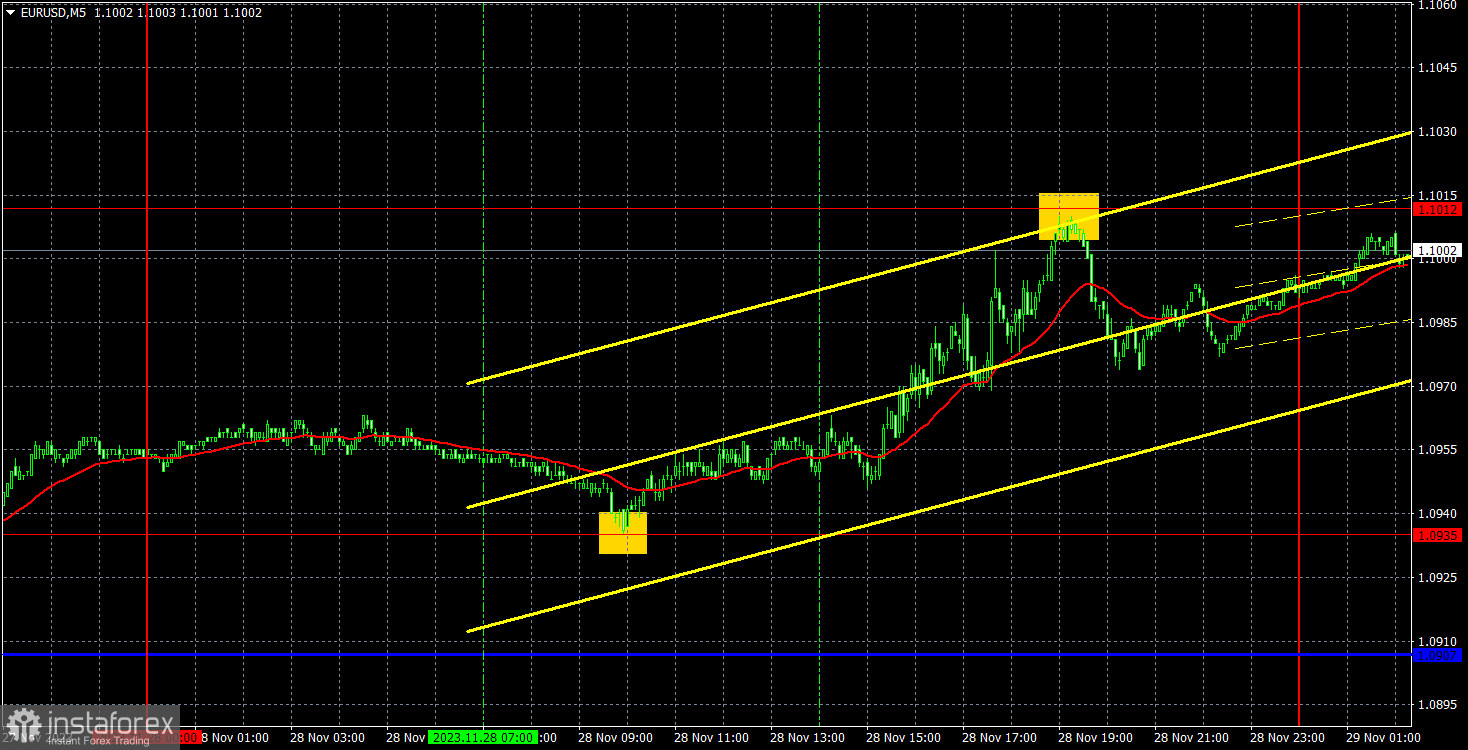
Only one trading signal was generated yesterday, but it was a good one. During the European trading session, the price bounced off the level of 1.0935, after which it managed to rise to the level of 1.1012. Traders should have worked on this buy signal, and on the rebound from the level of 1.1012 (which was also quite accurate), it was necessary to close long positions. The profit was about 50 pips. It was better not to execute the sell signal since it was formed too late. However, it could still yield a few dozen points.
COT report:
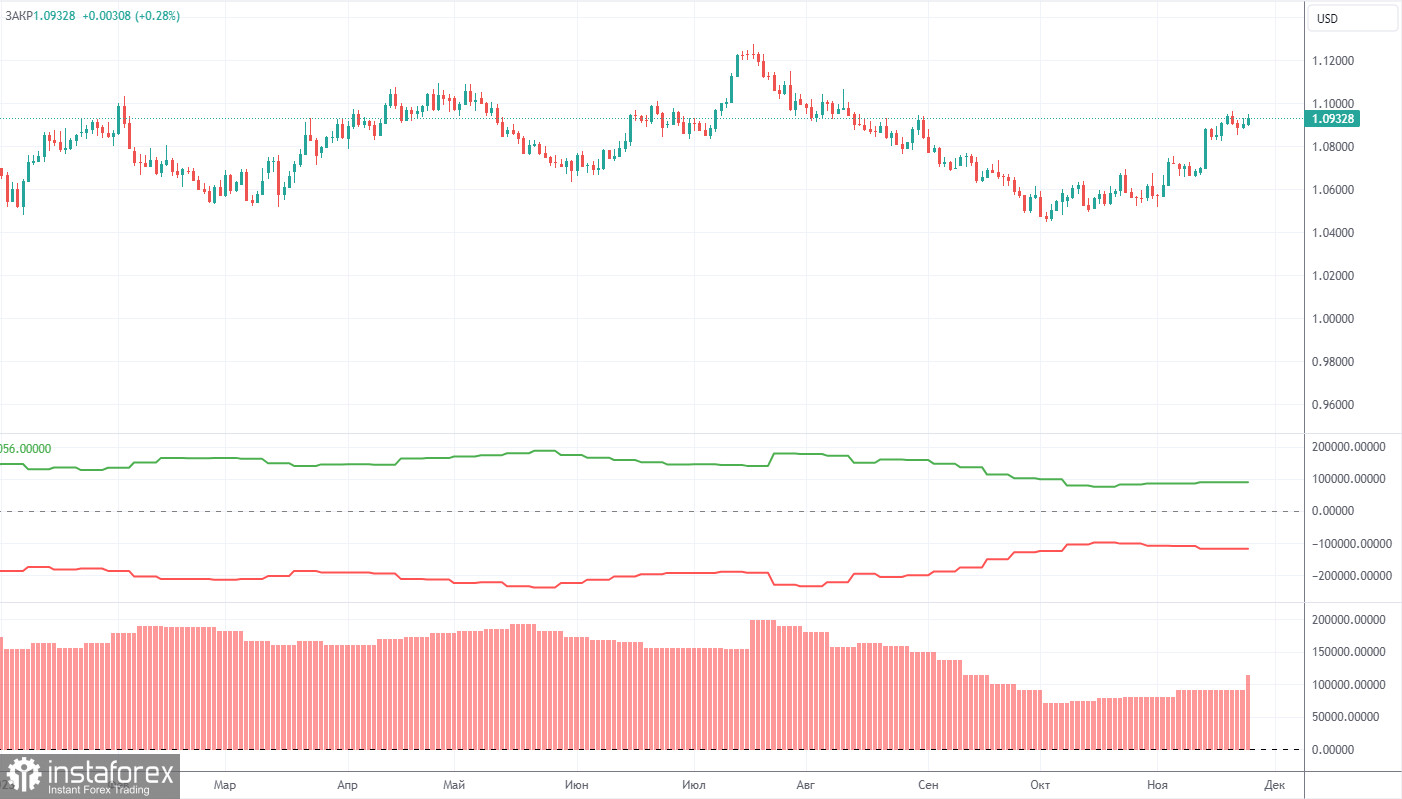
The latest COT report is dated November 14. Over the past 12 months, the COT report data has been consistent with what's happening in the market. The net position of large traders (the second indicator) began to rise back in September 2022, roughly at the same time that the euro started to rise. In the first half of 2023, the net position hardly increased, but the euro remained relatively high during this period. Only in the last three months, we have seen a decline in the euro and a drop in the net position, as we anticipated. However, in the last few weeks, both the euro and the net position have been rising. Therefore, we can draw a clear conclusion: the pair is correcting higher, and the corrective phase has not yet ended.
We have previously noted that the red and green lines have moved significantly apart from each other, which often precedes the end of a trend. This configuration persisted for over half a year, but ultimately, the lines have started moving closer to each other. Therefore, we still stick to the scenario that the upward trend is over. During the last reporting week, the number of long positions for the "non-commercial" group increased by 8,700, while the number of short positions fell by 11,100. Consequently, the net position increased by 19,800. The number of BUY contracts is still higher than the number of SELL contracts among non-commercial traders by 109,000. In principle, it is now evident even without COT reports that the euro is set to extend its weakness. However, the corrective phase has not yet ended.
Analysis of EUR/USD 1H
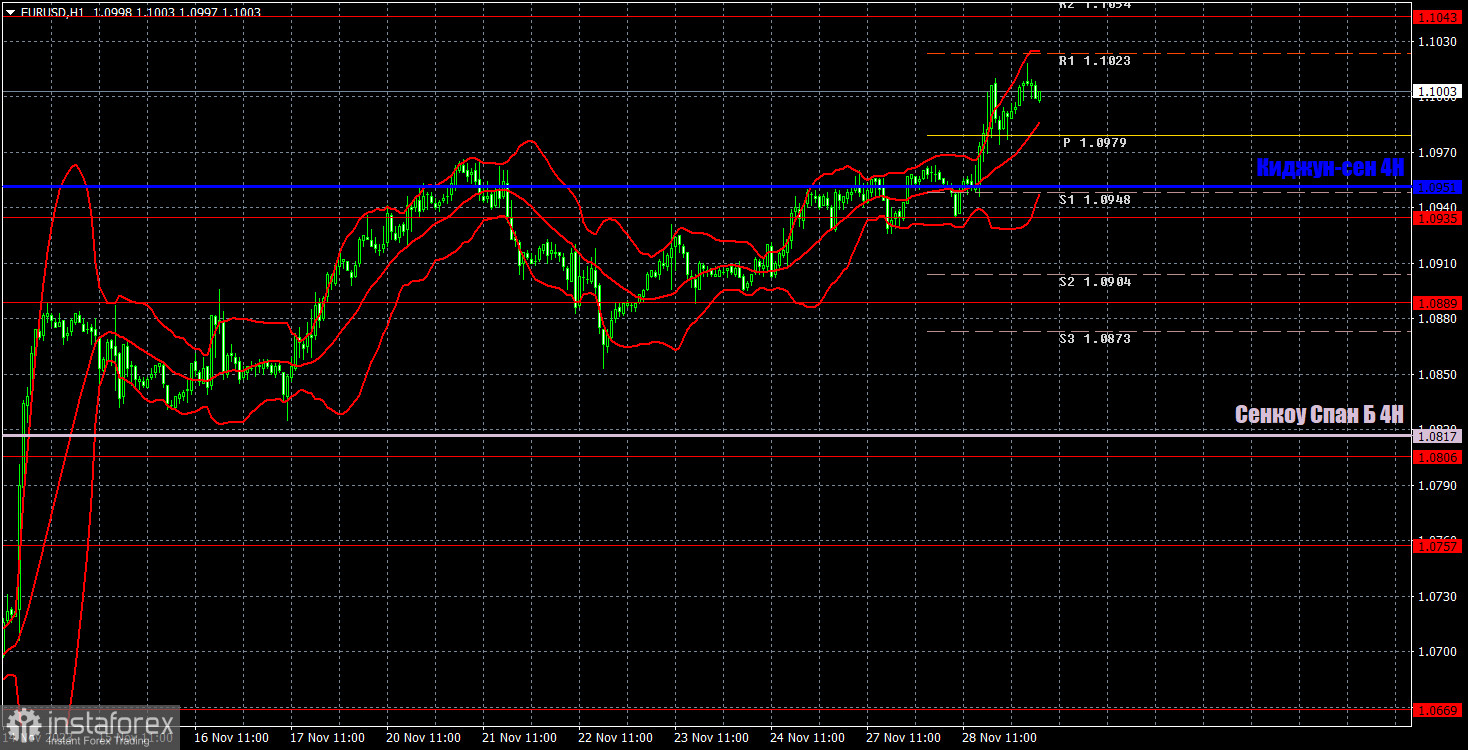
On the 1-hour chart, the pair continues its upward movement, despite the absence of growth factors and even a macroeconomic or fundamental background. Since the price is above the Ichimoku indicator lines, there is currently no reason to sell the pair. Nevertheless, we still believe that the euro's current growth is unwarranted and should end with the pair's strong downward movement.
On November 29, we highlight the following levels for trading: 1.0530, 1.0581, 1.0658-1.0669, 1.0757, 1.0806, 1,0889, 1,0935, 1,1012, 1,1092, 1,1137, as well as the Senkou Span B (1.0817) and Kijun-sen (1.0951) lines. The Ichimoku indicator lines can shift during the day, so this should be taken into account when identifying trading signals. There are also auxiliary support and resistance levels, but signals are not formed near them. Signals can be "bounces" and "breakouts" of extreme levels and lines. Don't forget to set a breakeven Stop Loss if the price has moved in the right direction by 15 pips. This will protect against potential losses if the signal turns out to be false.
On Wednesday, we expect a very small amount of important data. The German inflation report for November will be published, and the U.S. with its third estimate of the quarterly GDP data. Both the first and second reports have extremely low chances of being worked out by the market. Especially considering that the market is currently occupied only with buying the euro and selling the dollar.
Description of the chart:
Support and resistance levels are thick red lines near which the trend may end. They do not provide trading signals;
The Kijun-sen and Senkou Span B lines are the lines of the Ichimoku indicator, plotted to the 1H timeframe from the 4H one. They provide trading signals;
Extreme levels are thin red lines from which the price bounced earlier. They provide trading signals;
Yellow lines are trend lines, trend channels, and any other technical patterns;
Indicator 1 on the COT charts is the net position size for each category of traders;
Indicator 2 on the COT charts is the net position size for the Non-commercial group.


