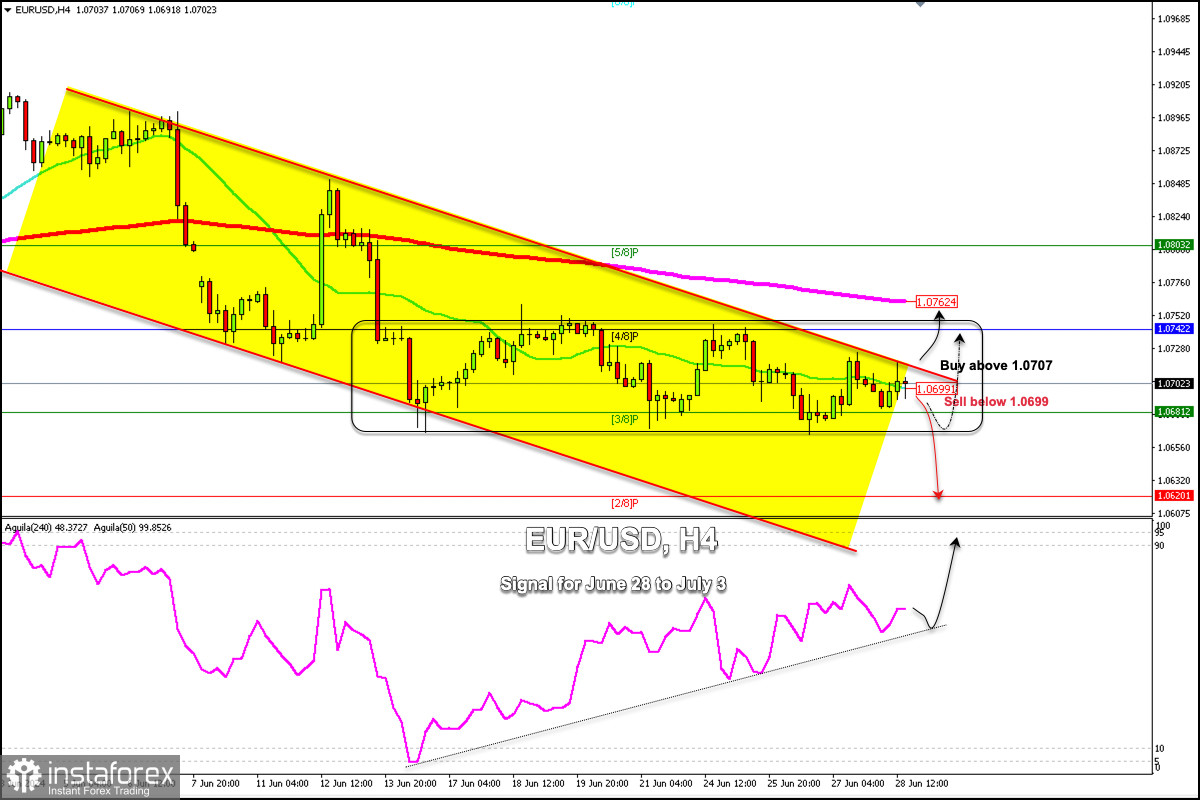
In the H4 chart, we can see that the EUR/USD pair is trading above the 21 SMA and within the downtrend channel forming since early June.
In case the euro breaks this channel sharply, we could expect an upward movement to occur and EUR/USD could reach the 200 EMA located at 1.0762 and could even reach 5/8 of Murray located at 1.0803.
On the other hand, in case the euro comes under strong downward pressure, we could look for opportunities to sell below 1.0699 with targets at 1.0650 and 2/8 Murray located at 1.0620.
The eagle indicator is showing a positive signal, but we have seen the euro consolidating above 1.0670 and below 1.0750 since June 13, forming a range between 3/8 Murray and 4/8 Murray.
This rectangle pattern could mean that if the Euro breaks any of these zones, we could expect a bearish continuation movement or a trend change.
Therefore, we believe that if the EUR/USD pair settles above 1.0670 (within the rectangle pattern), we could epect a further rise in the coming days.


