


Details of the Economic Calendar on November 29
The second estimate of the United States GDP for the third quarter turned out to be significantly better than initial forecasts. The economy demonstrated growth of 5.2% against the expected 4.9%. This forecast deviation led to a reduction in the volume of short positions against the U.S. dollar.
Analysis of Trading Charts from November 29
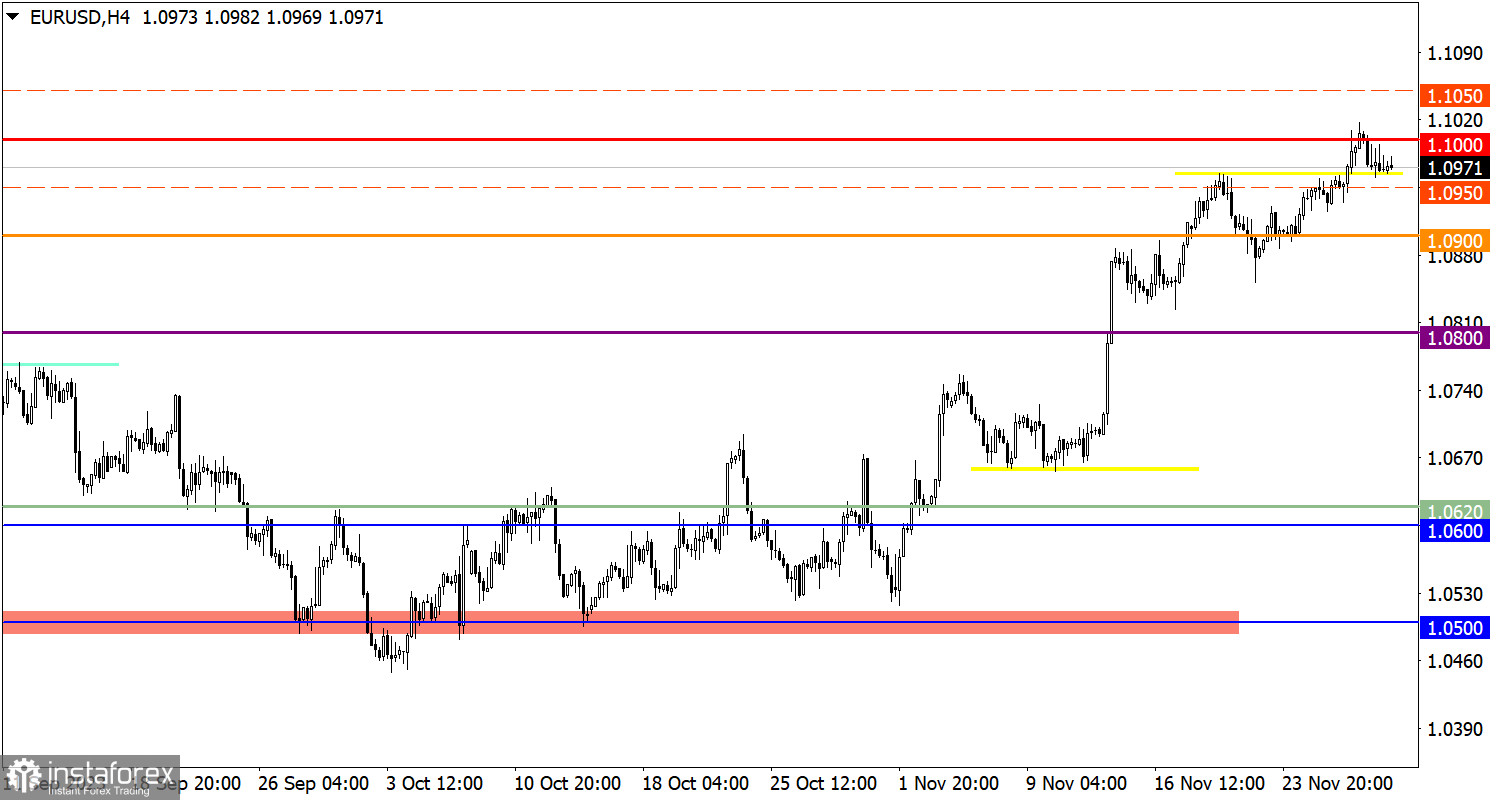
EUR/USD switched to a pullback stage as soon as the 1.1000 psychological level was reached. This movement aligns with the rhythmic component of the upward cycle.
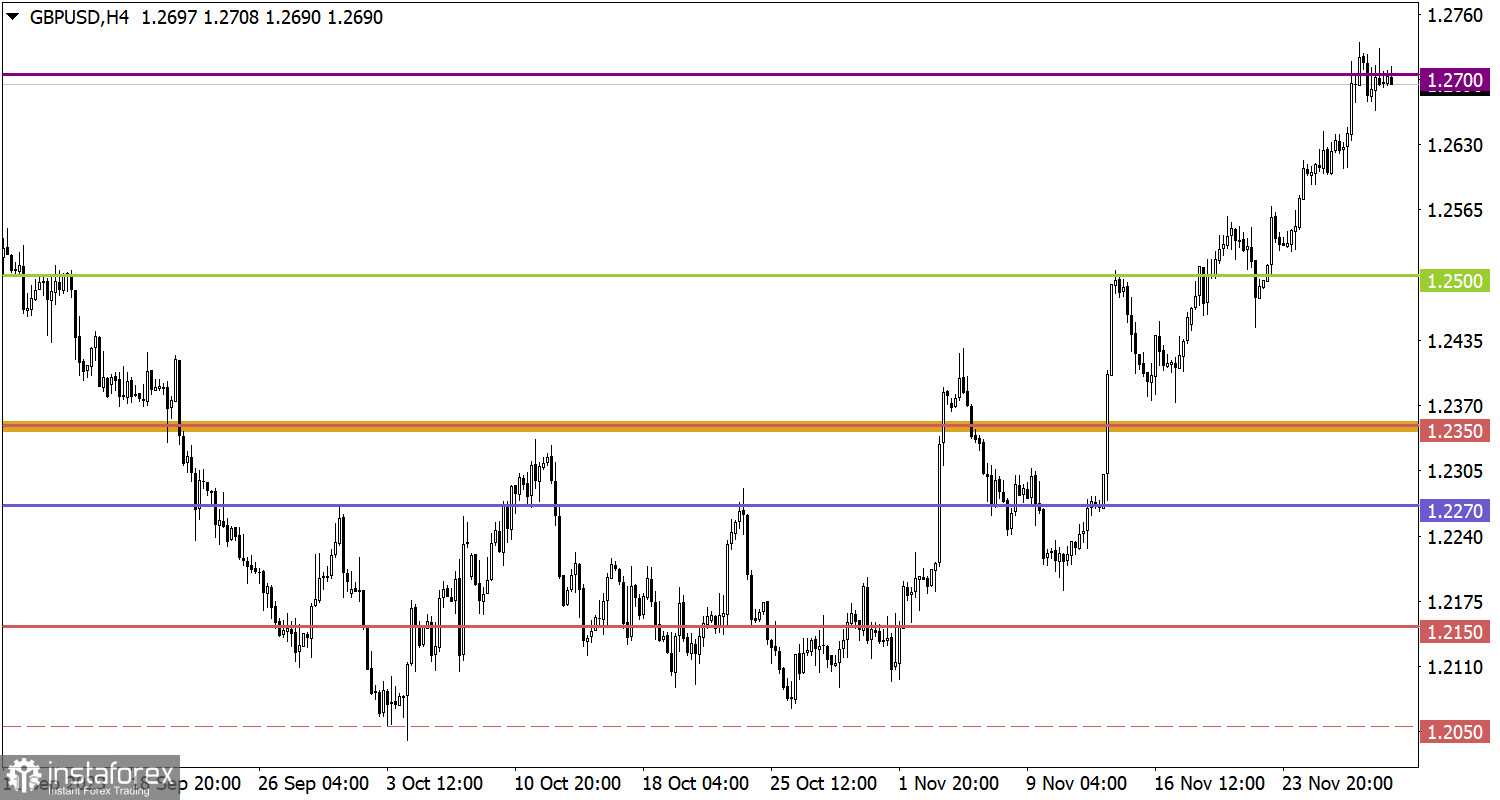
The GBP/USD pair reduced the volume of long positions near the 1.2700 resistance level. This led to the formation of a pullback, followed by a stagnation along the established level, indicating the preservation of the upward sentiment among market participants.

Economic Calendar on November 30
Today, the publication of the preliminary estimate of inflation in the EU is expected, where it is forecasted to decrease from 2.9% to 2.7%. Considering the intensive decrease in the inflation level, the ECB may indicate a sooner reduction in interest rates, which could negatively impact the euro exchange rate.
EUR/USD Trading Plan for November 30
It is expected that the subsequent increase in the volume of long positions will occur after the price returns above the level of 1.1000. However, for a clear technical signal of trend prolongation, price stabilization above the level of 1.1050 is required. Until that moment, the pullback stage will persist in the market, which may lead to a subsequent decline in the euro exchange rate.
GBP/USD Trading Plan for November 30
The current stagnation may represent a stage of reorganizing trading forces, which theoretically, in the context of technical analysis, could contribute to the extension of the upward cycle. However, for further growth in the volume of long positions, it is not enough to simply stabilize at the level of 1.2700; it is necessary to update the current local high. Otherwise, the level of 1.2700, during a prolonged stagnation, may become resistance, leading to the formation of a corrective movement towards 1.2600.
What's on the charts
The candlestick chart type is white and black graphic rectangles with lines above and below. With a detailed analysis of each individual candle, you can see its characteristics relative to a particular time frame: opening price, closing price, intraday high and low.
Horizontal levels are price coordinates, relative to which a price may stop or reverse its trajectory. In the market, these levels are called support and resistance.
Circles and rectangles are highlighted examples where the price reversed in history. This color highlighting indicates horizontal lines that may put pressure on the asset's price in the future.
The up/down arrows are landmarks of the possible price direction in the future.


