


Details of the Economic Calendar on December 1
The Business Activity Index in the U.S. manufacturing sector came in line with expectations, and despite its decline from 50.0 to 49.4 points, there was no market reaction.
Analysis of Trading Charts from December 1
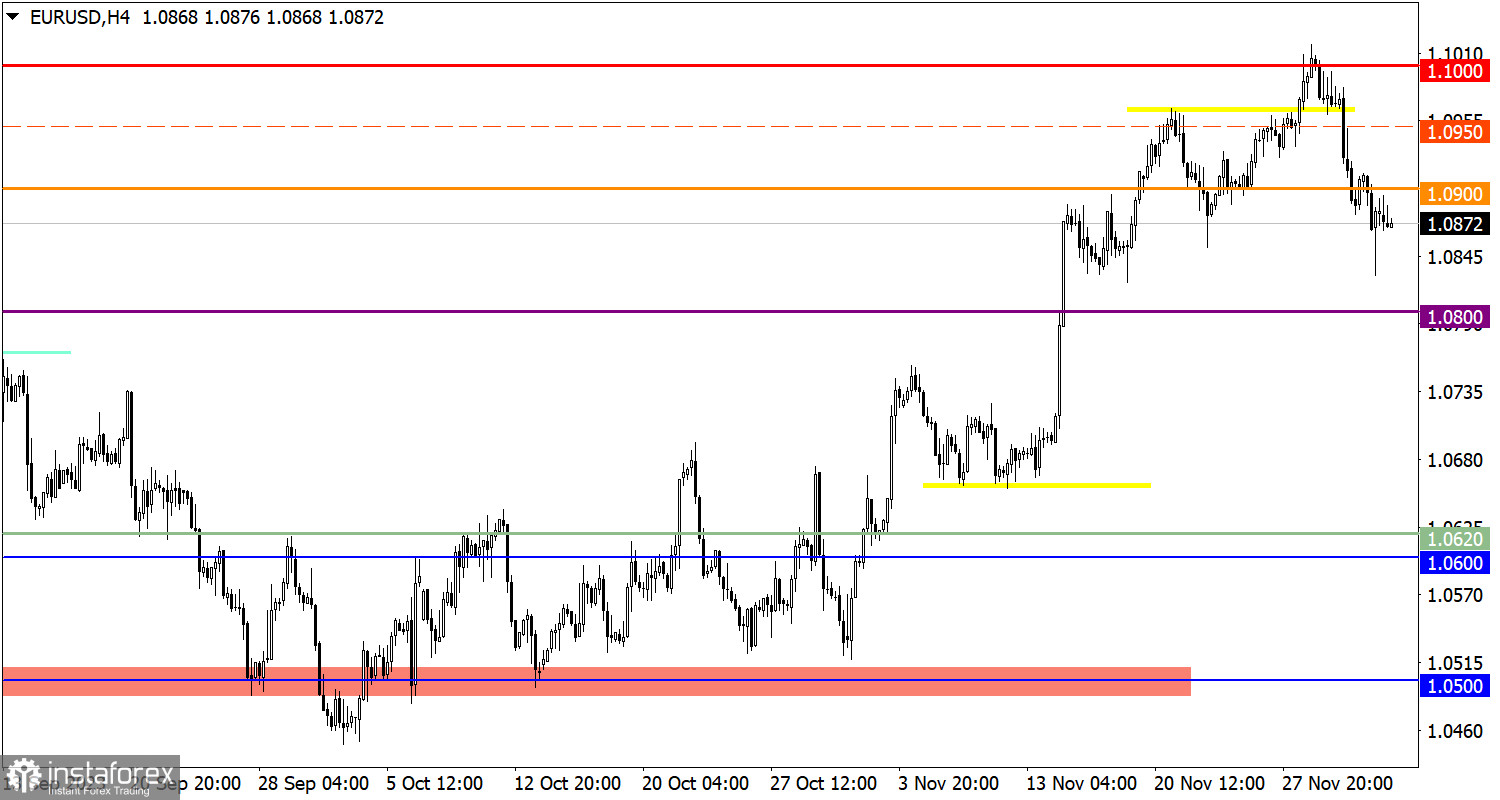
The EUR/USD currency pair slowed its downward momentum around the 1.0830 mark. As a result, a local increase in the volume of long positions occurred, leading to a technical pullback from the downward movement.
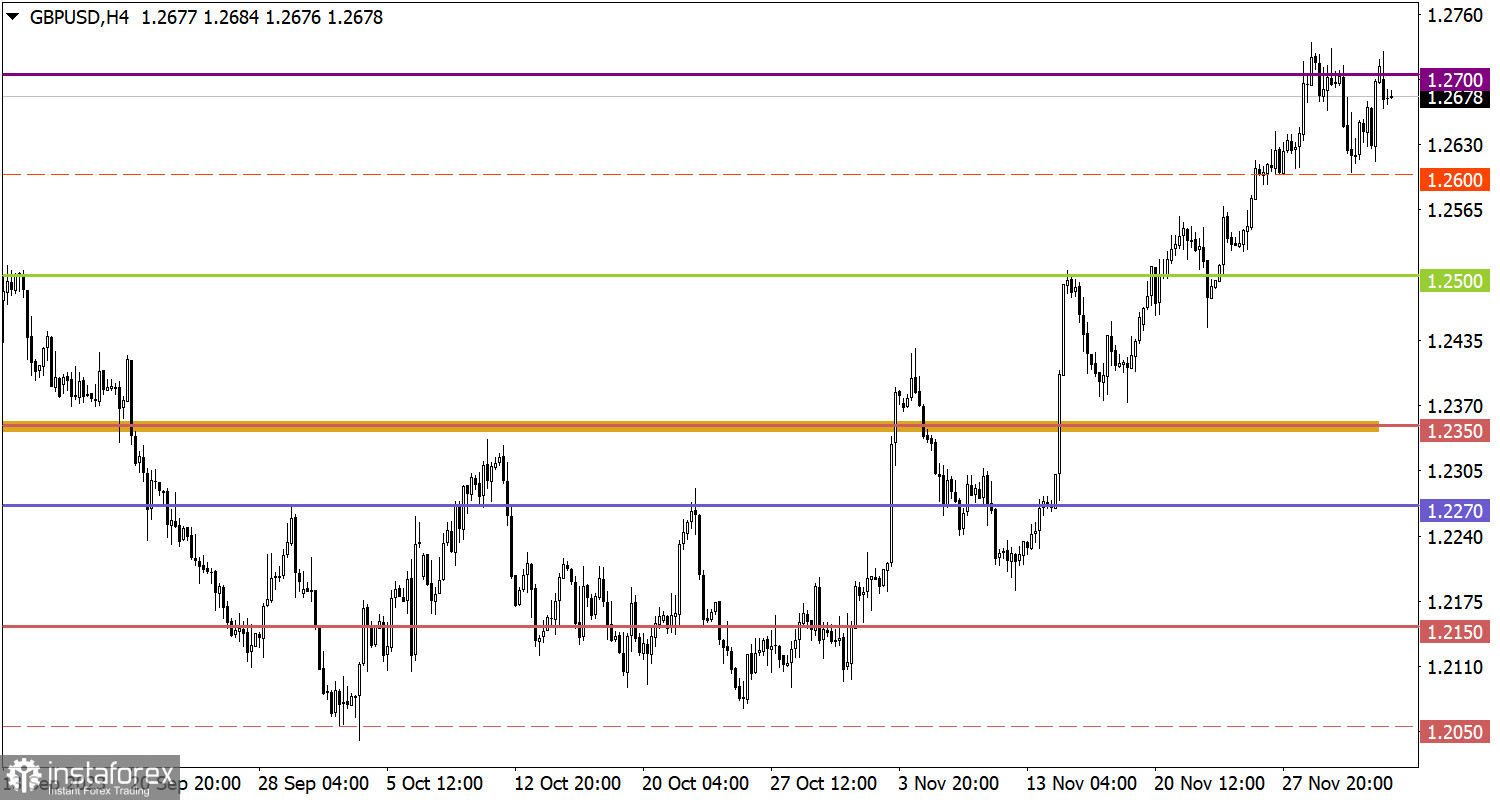
The GBP/USD pair managed to recover positions during last Friday's period relative to the recent corrective move. As a result of this movement, the quote returned to the area of the resistance level at 1.2700.

Economic Calendar for December 4
Today, the macroeconomic calendar is practically empty, and the only thing to pay attention to is the speech by European Central Bank President Christine Lagarde. Most likely, Lagarde will once again note a confident slowdown in inflation and the possibility of a refinancing rate cut. She will likely not provide any specific timelines, but there will be enough hints to influence speculators' interest in the markets.
EUR/USD Trading Plan for December 4
Based on the pullback, the price practically reached the level of 1.0900, after which a stagnation occurred. For the euro to continue its recovery phase, stabilization above the 1.0900 level is necessary. Otherwise, the level may play the role of resistance, reinforcing short positions, based on which an update of the local low of the downward cycle is possible.
GBP/USD Trading Plan for December 4
Since the opening of the new trading week, there has been a reduction in the volume of long positions, accompanied by a price rebound from the 1.2700 level. In this situation, a retest of the 1.2700 level indicates a prevailing bullish sentiment among market participants. In perspective, this may indicate a prolonged upward movement in the event of updating the local high of the previous week. As for the downward scenario, it is considered on the market as a sideways cycle between the levels of 1.2600/1.2700.
What's on the charts
The candlestick chart type is white and black graphic rectangles with lines above and below. With a detailed analysis of each individual candle, you can see its characteristics relative to a particular time frame: opening price, closing price, intraday high and low.
Horizontal levels are price coordinates, relative to which a price may stop or reverse its trajectory. In the market, these levels are called support and resistance.
Circles and rectangles are highlighted examples where the price reversed in history. This color highlighting indicates horizontal lines that may put pressure on the asset's price in the future.
The up/down arrows are landmarks of the possible price direction in the future.


