


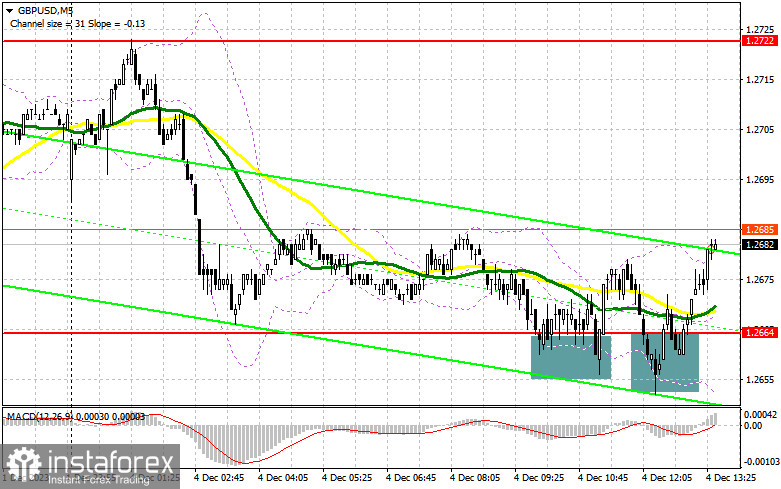
In my morning forecast, I drew attention to the level of 1.2664 and recommended making entry decisions based on it. Let's look at the 5-minute chart and analyze what happened there. The decline and the formation of a false breakout at 1.2664 led to an excellent buy signal, continuing the upward trend. The pair has already increased by more than 20 points when writing this article. The technical picture for the second half of the day has not been revised.
To open long positions on GBP/USD:
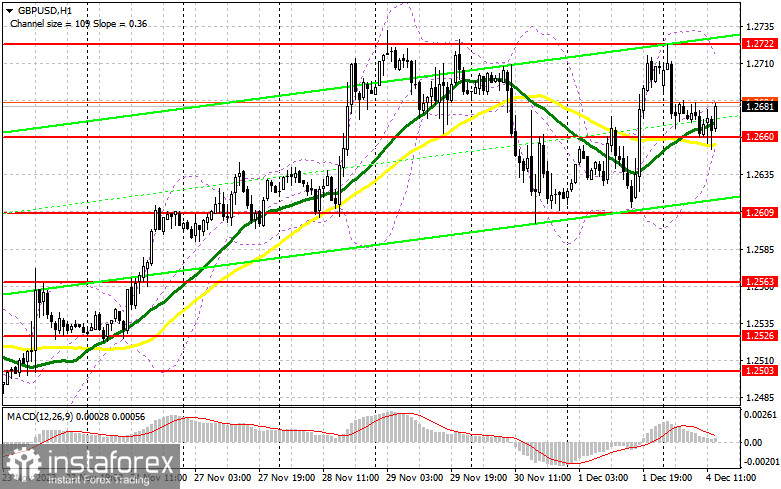
Several unsuccessful attempts to break below 1.2664 still keep the chances of returning the pound to the area of the monthly maximum. Considering there are no significant US statistics today, in case of a decline in the pair, you can still hope for a slightly revised level of 1.2660. Only the formation of a false breakout there, similar to what I analyzed above, will provide an entry point for long positions to restore GBP/USD and test resistance at 1.2722 – the upper boundary of the sideways channel. A breakout and consolidation above 1.2722 will allow buying to update the monthly maximum at 1.2761. The ultimate target will be the area of 1.2797, where I will take profits. In the scenario of a pair decline and the absence of bullish activity at 1.2660 during the American session (as this level has already been tested several times today), it is unlikely that we can say that things have gone badly for buyers, but the correction will intensify. In this case, only a false breakout around the next support at 1.2609 will signal the opening of long positions. I plan to buy GBP/USD immediately on the rebound from 1.2563 to correct within the day by 30-35 points.
To open short positions on GBP/USD:
Sellers retain all chances of building a downward correction. However, I plan to sell against the trend only today after protecting the resistance at 1.2722. The formation of a false breakout there will allow a downward movement toward support at 1.2660, where moving averages favoring buyers are located. Therefore, only a breakout and a bottom-up retest of this range, which was not achieved in the first half of the day, will deliver a more serious blow, leading to stop-loss sweeps and opening the way to 1.2609. A more distant target will be the area of 1.2563, where I will take profits. The upward trend will return in the case of GBP/USD growth and the absence of activity at 1.2722 during the American session. In this case, I will postpone sales until a false breakout at 1.2761. If there is no downward movement, I will sell GBP/USD immediately on the rebound from 1.2797, but only with the expectation of a pair correction down by 30-35 points within the day.
Indicator signals:
Moving averages
Trading occurs around the 30 and 50-day moving averages, indicating market confusion with direction.
Note: The author considers the period and prices of moving averages on the hourly chart H1, which differs from the general definition of classical daily moving averages on the daily chart D1.
Bollinger Bands
In case of a decline, the lower boundary of the indicator at 1.2660 will act as support.
Description of Indicators:
- Moving average (determines the current trend by smoothing volatility and noise). Period 50. Marked on the chart in yellow.
- Moving average (determines the current trend by smoothing volatility and noise). Period 30. Marked on the chart in green.
- MACD indicator (Moving Average Convergence/Divergence — convergence/divergence of moving averages) Fast EMA period 12. Slow EMA period 26. SMA period 9.
- Bollinger Bands (Bollinger Bands). Period 20.
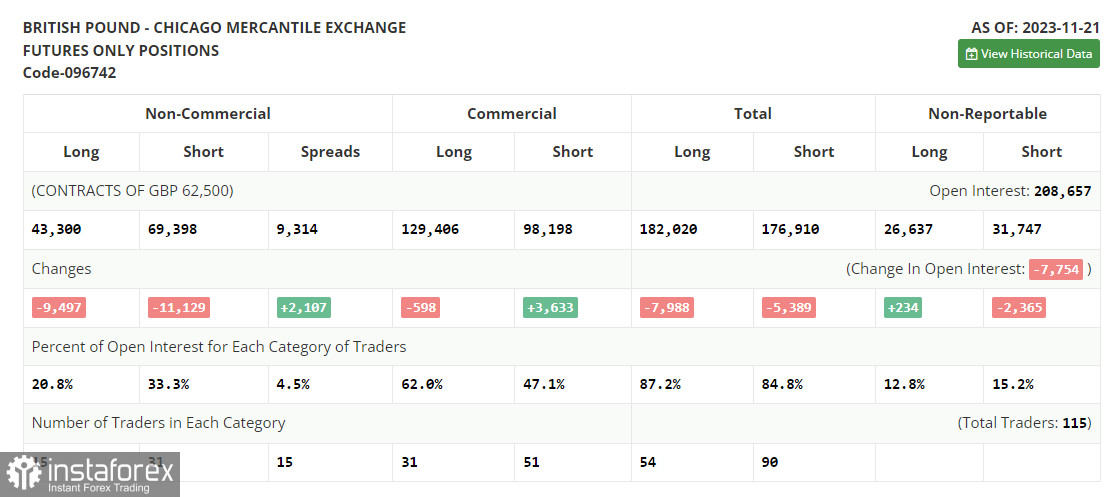
- Non-commercial traders - speculators, such as individual traders, hedge funds, and large institutions, use the futures market for speculative purposes and meet certain requirements.
- Long non-commercial positions represent the total long open position of non-commercial traders.
- Short non-commercial positions represent the total short open positions of non-commercial traders.
- The total non-commercial net position is the difference between non-commercial traders' short and long positions.


