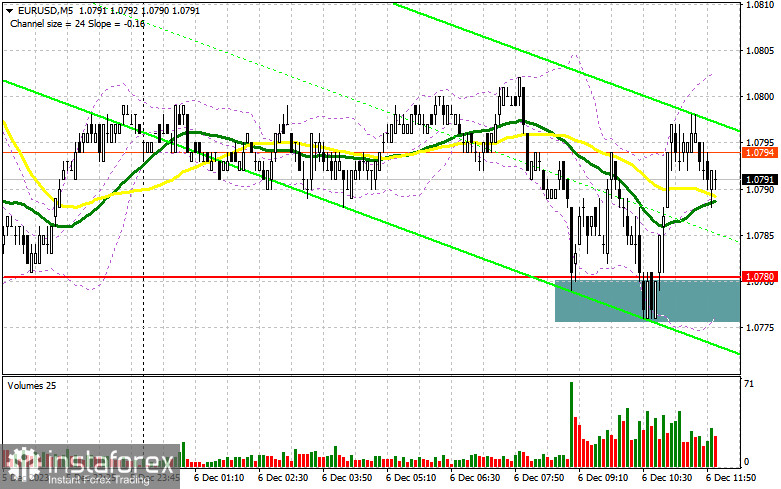
In my morning forecast, I drew attention to the level of 1.0780 and recommended making entry decisions based on it. Let's look at the 5-minute chart and analyze what happened. The decline and the formation of a false breakout around 1.0780 provided a good buy signal. However, substantial growth in the pair did not materialize. After a 20-point upward movement, volatility sharply decreased. The technical picture remained unchanged for the second half of the day.

To open long positions on EUR/USD:
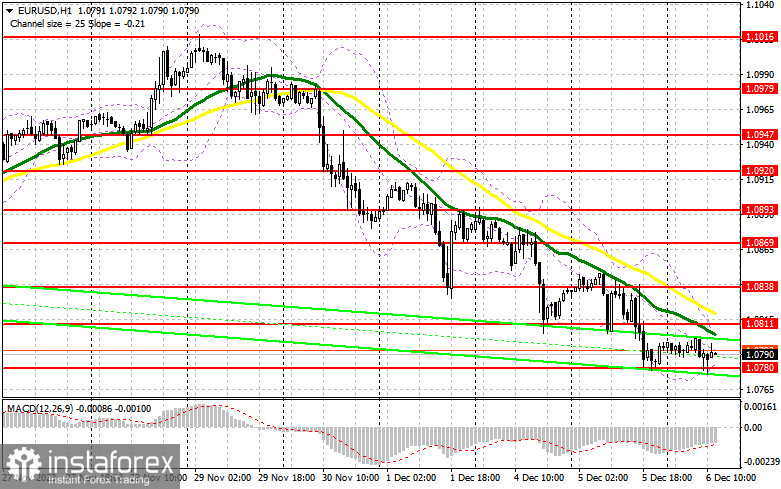
The released data on retail sales for October in the Eurozone disappointed investors but did not significantly impact the market. The focus has shifted to the ADP Employment Change report in the U.S. private sector and the trade balance. The direction of the dollar will depend on labor market figures. If the numbers prove convincing, demonstrating the economy's resilience even amid November strikes, pressure on the euro will return, potentially pushing the pair back to the support level of 1.0780, which twice saved EUR/USD from falling in the last 24 hours. Only another false breakout like the one discussed above would provide a buying entry point, anticipating a rise in EUR/USD and a test of the resistance at 1.0811 formed yesterday. Breaking through and updating it from top to bottom will depend on the ADP data, and a weak report will likely signal a buying opportunity, maintaining the chance for a correction and an update to 1.0838. The ultimate target will be the area of 1.0869, where I would take profits. In the case of further decline in EUR/USD and no activity at 1.0780 in the second half of the day, the downtrend in the pair will continue, creating more problems for buyers. In this scenario, I would only enter the market after a false breakout around 1.0752 – the new local minimum. I would consider opening long positions only after a bounce from 1.0722, targeting an upward correction of 30-35 points within the day.
To open short positions on EUR/USD:
Sellers continue to control the market, but the situation can turn against them anytime. For a further bearish market, it is essential to stay below 1.0811, where the moving averages supporting sellers are located. Only forming a false breakout after strong labor market data would provide an excellent selling signal, counting on a further decline in the euro. The nearest target is the support at 1.0780, already worked out today, so I do not expect significant buyer activity at this level. Only after breaking through and consolidating below this range, as well as a bottom-up retest, do I expect to receive another selling signal with an exit at 1.0752. The ultimate target will be the minimum of 1.0722, where I would take profits. In the event of an upward movement in EUR/USD during the U.S. session, and if bears are absent at 1.0811, buyers will try to stop the bearish market and restore balance. This will open the way to 1.0838. Selling could be considered there, but again, only after an unsuccessful consolidation. I recommend opening short positions immediately on a rebound from 1.0869, targeting a downward correction of 30-35 points.


Indicator Signals:
Moving Averages
Trading is below the 30- and 50-day moving averages, indicating the sellers' advantage.
Note: The author considers the period and prices of moving averages on the hourly chart (H1) and differs from the general definition of classical daily moving averages on the daily chart (D1).
Bollinger Bands
In case of a decline, the lower boundary of the indicator will act as support around 1.0780.
Description of Indicators:
- Moving Average (50 periods, marked in yellow on the chart)
- Moving Average (30 periods, marked in green on the chart)
- MACD Indicator (12, 26, 9)
- Bollinger Bands (20)
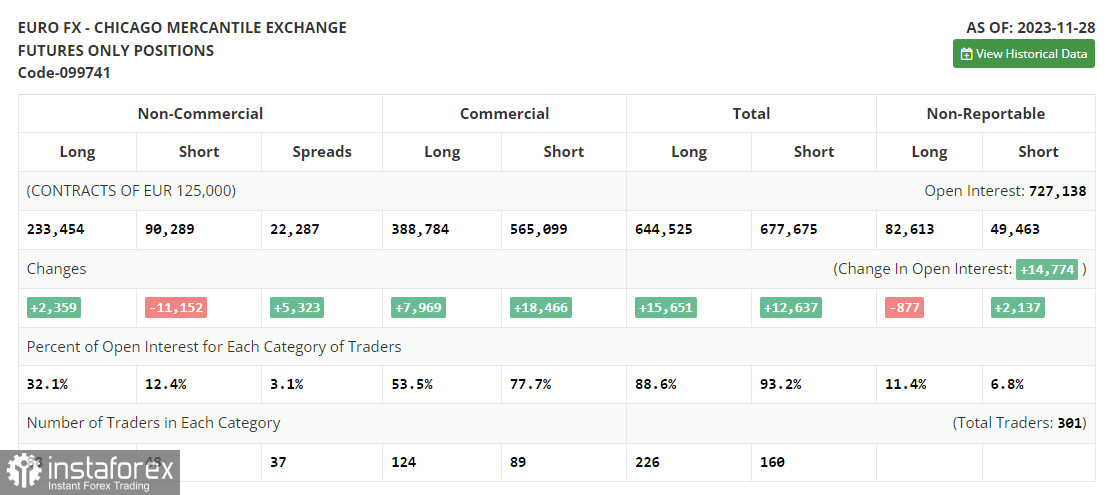
- Non-commercial traders - speculators such as individual traders, hedge funds, and large institutions using the futures market for speculative purposes and meeting specific requirements.
- Long non-commercial positions represent the total long open positions of non-commercial traders.
- Short non-commercial positions represent the total short open positions of non-commercial traders.
- The total non-commercial net position is the difference between non-commercial traders' short and long positions.


