


Trend analysis (Fig. 1).
The GBP/USD currency pair may move upward from the level of 1.2551 (closing of yesterday's daily candle) to test the 1.2582 resistance level (blue thick line). After this, a downward movement is possible to test 1.2532, the 21-day EMA (thin black line). Much will depend on the news.
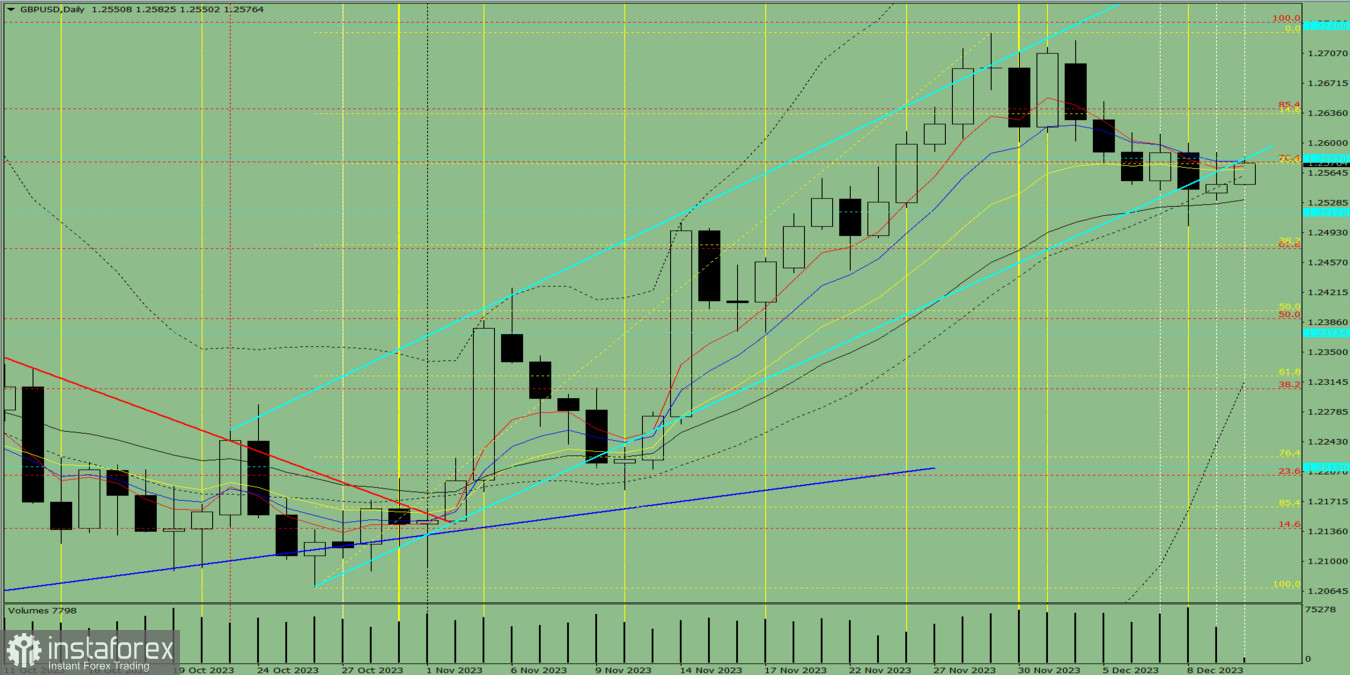
Fig. 1 (daily chart).
Comprehensive analysis:
- Indicator analysis – up;
- Volumes – up;
- Candlestick analysis – up;
- Trend analysis – up;
- Bollinger bands – up;
- Weekly chart – up.
General conclusion: Today, the price may move upward from the level of 1.2551 (closing of yesterday's daily candle) to test the 1.2582 resistance level (blue thick line). After this, a downward movement is possible to test 1.2532, the 21-day EMA (thin black line). Much will depend on the news.
Alternatively, the price may move upward from the level of 1.2551 (closing of yesterday's daily candle) to test the upper fractal at 1.2611 (daily candle from 07/12/2023). Upon reaching this level, a downward movement is possible to test 1.2518, the historical support level (blue dotted line).


