


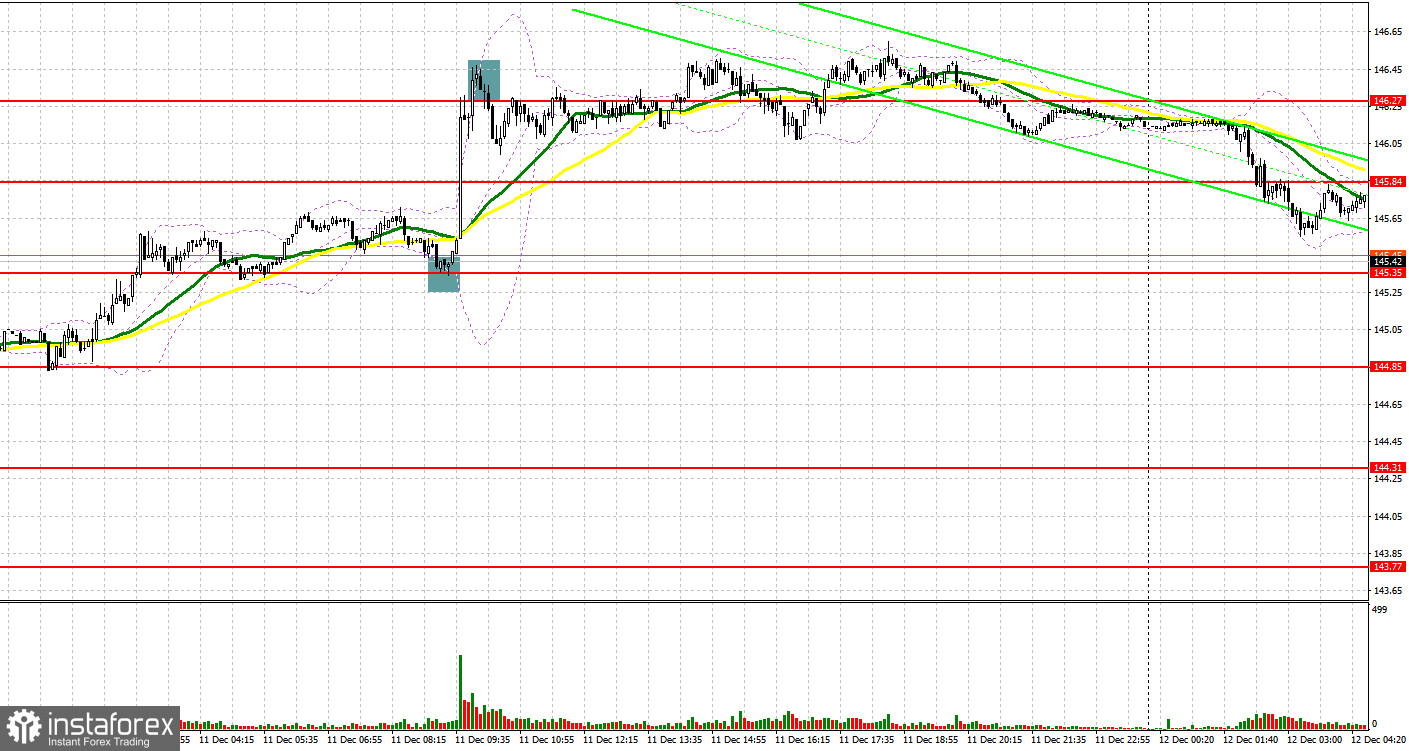
Yesterday, the instrument generated several market entry signals. Let's take a look at the 5-minute chart and analyze what happened there. A false breakout around the resistance level of 145.35 produced an excellent buy signal, enabling a further bullish trend. As a result, USD/JPY rose by 90 pips. The defense of 146.27 entailed a counter-trend sell signal, after which the pair dropped by 30 pips. This is the way USD/JPY closed yesterday.
What is needed to open long positions on USD/JPY
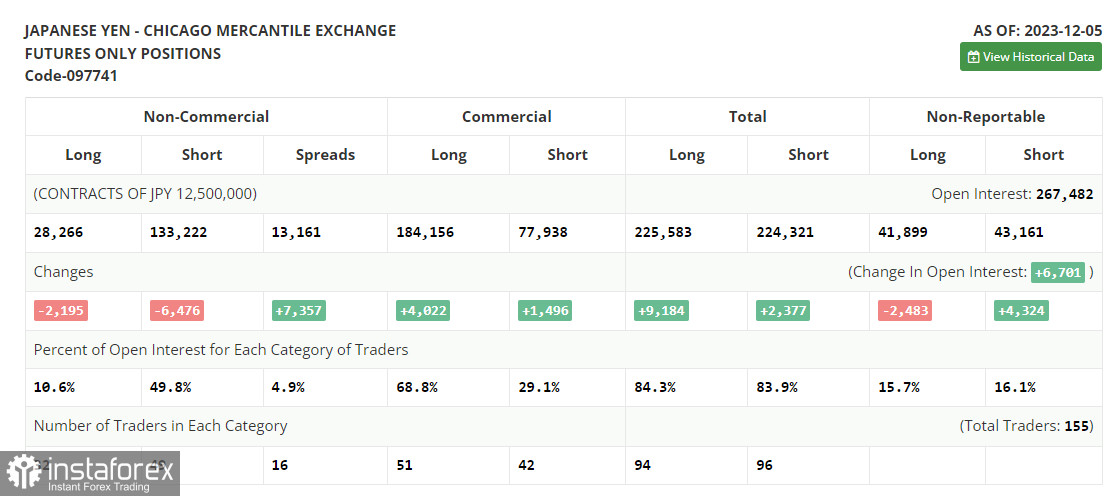
Before analyzing the technical picture of USD/JPY, let's take a look at what happened in the futures market. The Commitment of Traders (COT) report for December 5th showed a decrease in both long and short positions. No wonder! Recent statements from the Bank of Japan suggesting that ultra-loose policy and negative interest rates will no longer be necessary next year have triggered a spike in the yen and weakened the dollar's positions. However, after the biggest USD/JPY sell-off recently, traders quickly bought the instrument during the dip, thus offsetting 2/3 of the decline. Much will depend this week on the Federal Reserve's decision on interest rates. If the policy remains tight, the Japanese yen will likely face more troubles, leading to further growth in the pair. The latest COT report indicates that long non-commercial positions fell by 2,195 to 28,266, while short non-commercial positions decreased by 6,476 to 133,222, increasing the spread between long and short positions by 7,357.
The sellers have already covered yesterday's growth and continue to put pressure on the pair. A spike in volatility is most likely to occur in the second half of the day following an important US inflation report. If the CPI declines, pressure on USD/JPY will increase even more. If inflation rises in the US in November this year, this boost demand for the US dollar, so the buyers today have a great chance to enter the market at attractive prices amid the pair's decline. The bulls now need to work hard to defend the 145.35 level, where a false breakout will signal buying with the aim of rising to the 145.93 resistance area, where the moving averages are located. A breakout and consolidation above this range will allow the bulls to strengthen their positions in the market. They will rush opening long positions with a target at 146.56, this week's high. The highest target will be 147.22, where I plan to take profits. In a scenario of USD/JPY's decline and lack of buying activity at 145.35, the pair will come under selling pressure. In this case, I will try to enter the market around 144.85, but only a false breakout there will signal opening long positions. I plan to buy USD/JPY immediately on a dip from 144.31, projecting a correction of 30-35 pips within the day.
What is needed to open short positions on USD/JPY
The sellers insist on a downward correction, but the chance of a larger sell-off remains slim. Everything will depend on US inflation. The best strategy would be to trade on a rise after a false breakout around the resistance area of 145.93, where I plan to get a good entry point for selling with a move towards the support at 145.35, formed yesterday. A breakout and a reverse test from below upwards of this range will strike a more serious blow to the buyers' positions, leading to the activation of stop orders and opening the path to the low of 144.85. A lower target area will be 144.31, where I intend to take profits. In the scenario of a rise in USD/JPY and an absence of activity at 145.93 following the US data, it would be best to postpone selling until the test of the next resistance at 146.56. If there is no downward movement there, I will be selling USD/JPY immediately on a rebound from 147.22, expecting a correction in USD/JPY down by 30-35 pips within the day.
Indicators' signals
Moving averages
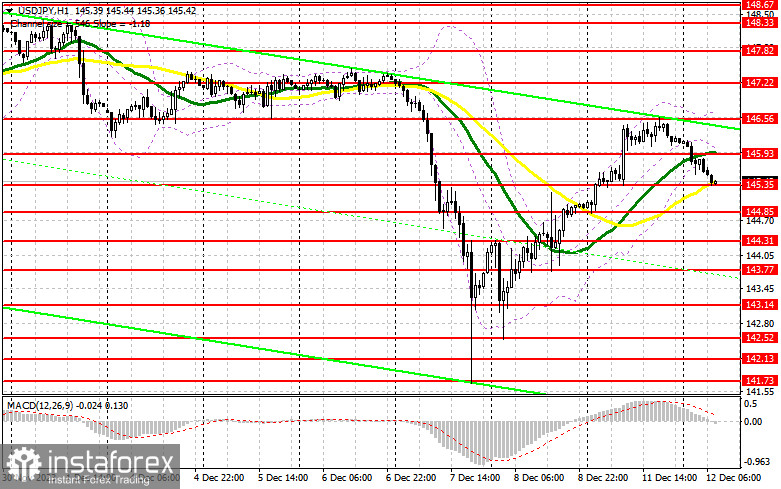
The instrument is trading at around the 30 and 50-day moving averages. It indicates uncertain market sentiment on USD/JPY.
Note: The period and prices of the moving averages are considered by the analyst on the 1-hour chart and differ from the general definition of classic daily moving averages on the daily chart.
Bollinger Bands
In case USD/JPY goes down, the indicator's lower border at about 145.5 will act as support.
Description of indicators
- Moving average (moving average, determines the current trend by smoothing out volatility and noise). Period 50. It is marked yellow on the chart.
- Moving average (moving average, determines the current trend by smoothing out volatility and noise). Period 30. It is marked green on the chart.
- MACD indicator (Moving Average Convergence/Divergence — convergence/divergence of moving averages) Quick EMA period 12. Slow EMA period to 26. SMA period 9
- Bollinger Bands (Bollinger Bands). Period 20
- Non-commercial speculative traders, such as individual traders, hedge funds, and large institutions that use the futures market for speculative purposes and meet certain requirements.
- Long non-commercial positions represent the total long open position of non-commercial traders.
- Short non-commercial positions represent the total short open position of non-commercial traders.
- Total non-commercial net position is the difference between short and long positions of non-commercial traders.


