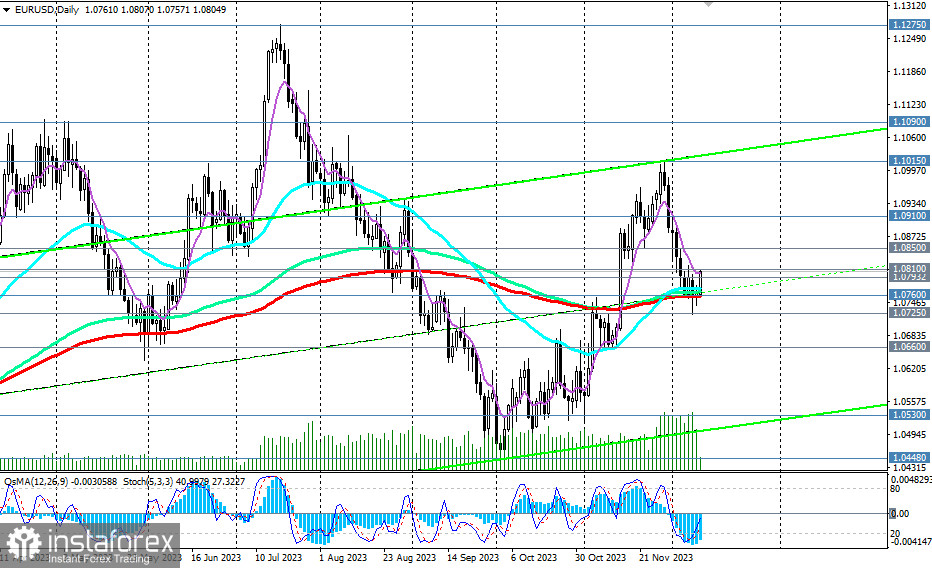
EUR/USD turned upward today after failing to break through the key support level at 1.0760 (the pair tested this level for the 5th consecutive trading day). The extent and strength of this movement will depend on today's inflation data in the United States, as well as the decisions of the Federal Reserve and the European Central Bank (ECB), both of which will hold meetings this week.

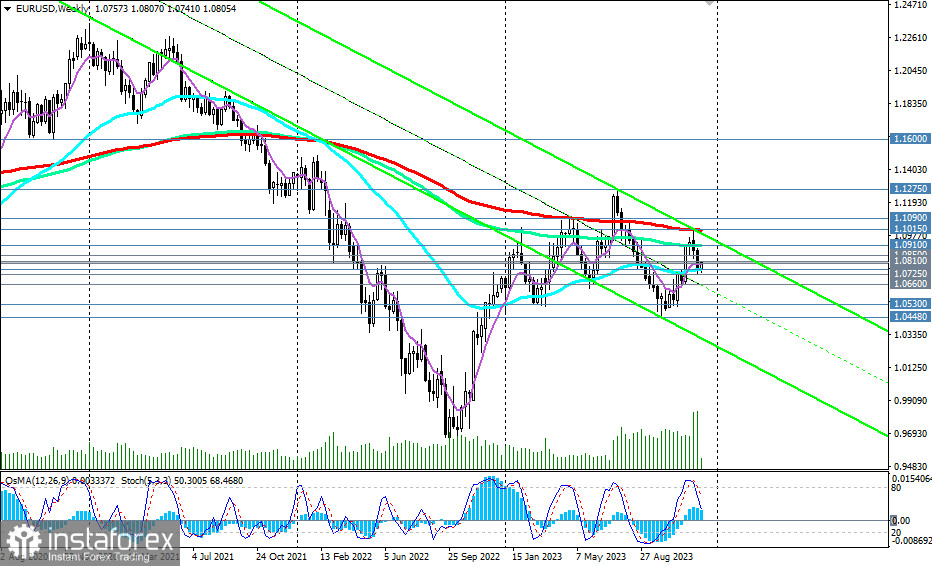
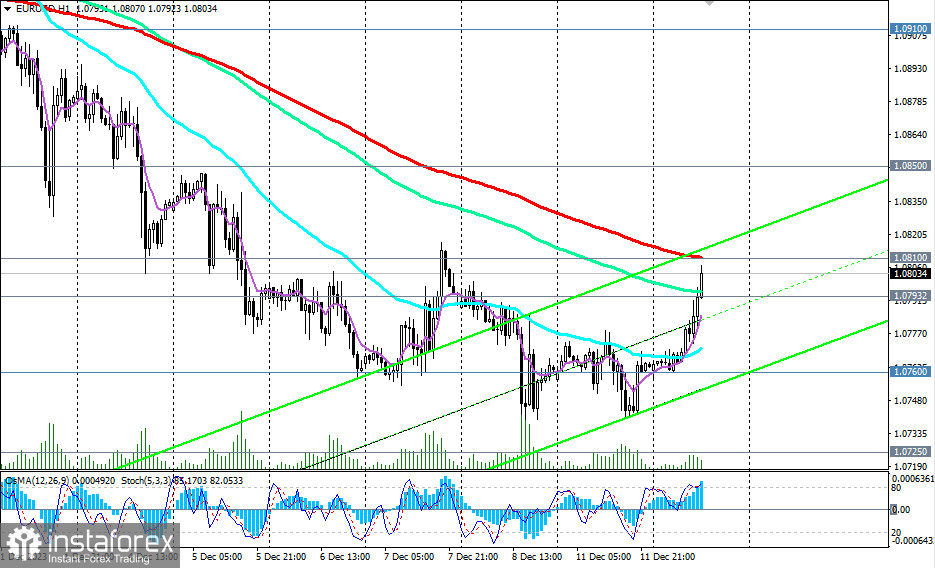
From a technical standpoint, for further upward movement, the price needs to first overcome the zone of significant short-term resistance levels at 1.0793 (200 EMA on the 4-hour chart) and 1.0810 (200 EMA on the 1-hour chart). The target for the corrective rise is the important resistance level at 1.0910 (144 EMA on the weekly chart). Breaking through the key resistance level at 1.1015 (200 EMA on the weekly chart) and local resistance levels at 1.1090 and 1.1100 will lead EUR/USD into the long-term bullish market zone.

Thus, the signal for new long positions is the breakout of the 1.0810 resistance level.
In the main scenario, EUR/USD will indeed break the key support level at 1.0760 (200 EMA on the daily chart, 50 EMA on the weekly chart) and, after breaking the local support at the level of 1.0725, will continue to decline.
The breakdown of these support levels will indicate the return of EUR/USD to a long-term downward trend, which the pair has been in since June 2021. The downside targets in the event of this scenario playing out are the local support levels at 1.0530, 1.0450, and then the marks of 1.0400, 1.0300, near which the lower boundary of the downward channel on the weekly chart passes.
Support levels: 1.0760, 1.0725, 1.0700, 1.0600, 1.0530, 1.0500, 1.0450, 1.0400, 1.0300
Resistance levels: 1.0793, 1.0800, 1.0810, 1.0850, 1.0900, 1.0910, 1.1000, 1.1015, 1.1090, 1.1100, 1.1200, 1.1275, 1.1300, 1.1400, 1.1500, 1.1600
Trading Scenarios:
Main Scenario: Sell Stop at 1.0780. Stop-Loss at 1.0820. Targets at 1.0760, 1.0725, 1.0700, 1.0600, 1.0530, 1.0500, 1.0450, 1.0400, 1.0300
Alternative Scenario: Buy Stop at 1.0820. Stop-Loss at 1.0780. Targets at 1.0850, 1.0900, 1.0910, 1.1000, 1.1015, 1.1090, 1.1100, 1.1200, 1.1275, 1.1300, 1.1400, 1.1500, 1.1600
"Targets" correspond to support/resistance levels. This also does not mean that they will necessarily be reached, but they can serve as a guide when planning and placing trading positions.


