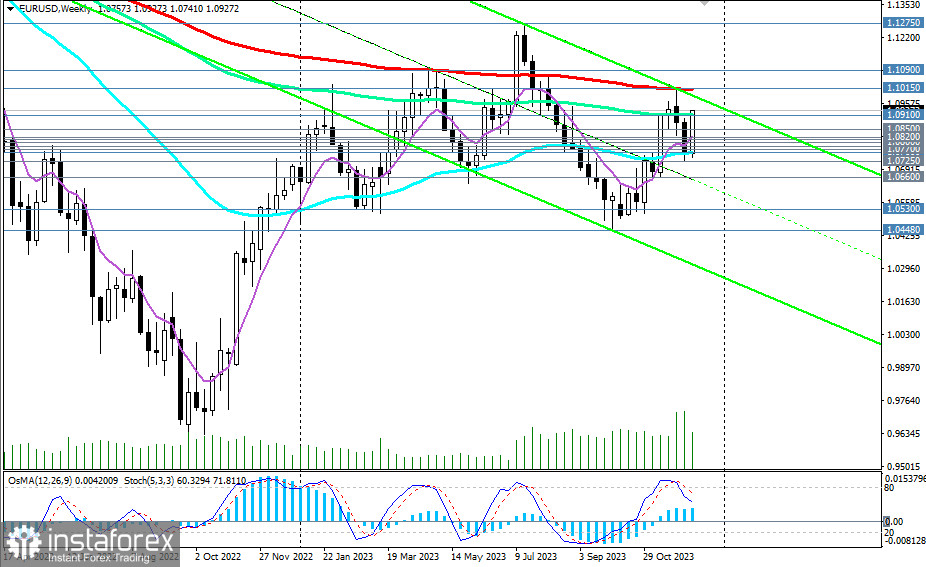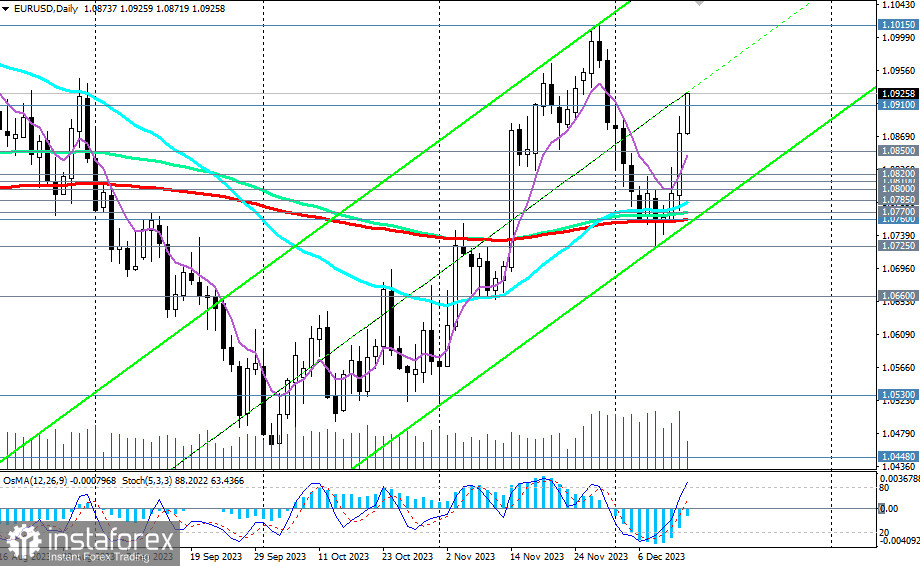
In our previous EUR/USD review on 12/12/2023, the main scenario anticipated a breakdown of the key support level at 1.0760 (200 EMA on the daily chart, 50 EMA on the weekly chart). After breaking the local support at the level of 1.0725, the continuation of the decline was expected, indicating a return of EUR/USD to the long-term downward trend.
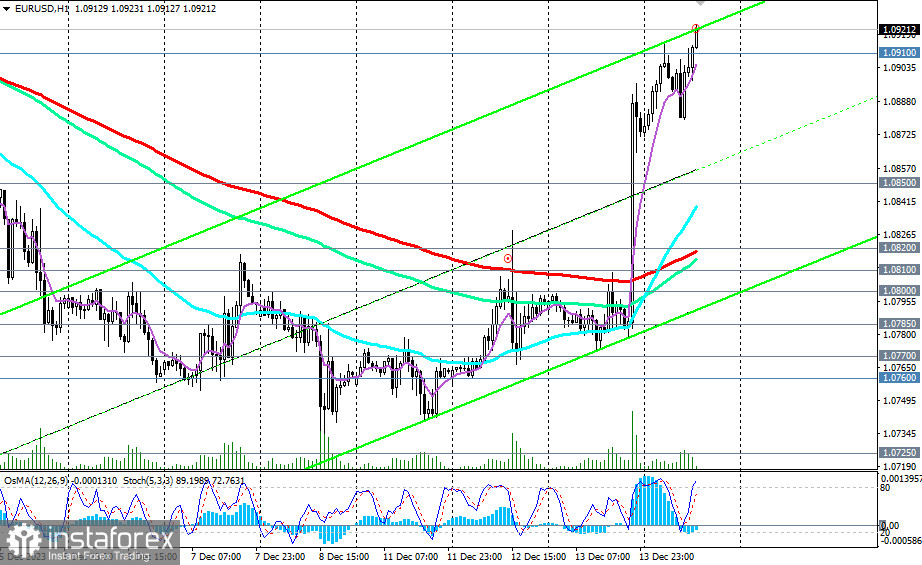
However, events are unfolding according to an alternative scenario (Buy Stop 1.0820. Stop-Loss 1.0780. Targets 1.0850, 1.0900, 1.0910, 1.1000, 1.1015, 1.1090, 1.1100, 1.1200, 1.1275, 1.1300, 1.1400, 1.1500, 1.1600), with the first three targets (1.0850, 1.0900, 1.0910) already achieved.

If European Central Bank leaders do not make sharply dovish statements today regarding the near-term prospects of the bank's monetary policy, then most market participants and economists expect further growth of the EUR/USD pair. Today, we assume a retest of resistance levels at 1.1000 and 1.1100.

The breakout and further growth will return EUR/USD to the long-term bullish market zone. The first signal for the implementation of this scenario could be the breakout of today's high of 1.0930.
In the alternative scenario, the growth of EUR/USD will stop near this level, followed by a reversal downward.
A signal to start implementing this scenario could be the breakdown of the "round" level of 1.0900 and today's low of 1.0872, with the nearest targets being short-term support levels 1.0800 (200 EMA on the 4-hour chart), 1.0820 (200 EMA on the 1-hour chart).
A breakdown of the key support level at 1.0760 (200 EMA on the daily chart, 50 EMA on the weekly chart) and the local support level at 1.0725 will confirm the return of EUR/USD to the long-term downward trend, in which the pair has been since June 2021. The targets for decline, if this scenario is realized, are local support levels 1.0530 and 1.0450, and then marks of 1.0400 and 1.0300, near which the lower boundary of the downward channel on the weekly chart passes.
Support levels: 1.0910, 1.0900, 1.0872, 1.0850, 1.0820, 1.0810, 1.0800, 1.0785, 1.0770, 1.0760, 1.0725, 1.0700, 1.0600, 1.0530, 1.0500, 1.0450, 1.0400, 1.0300
Resistance levels: 1.1000, 1.1015, 1.1090, 1.1100, 1.1200, 1.1275, 1.1300, 1.1400, 1.1500, 1.1600
Trading Scenarios:
Main Scenario: Buy Stop 1.0950. Stop-Loss 1.0870. Targets 1.1000, 1.1015, 1.1090, 1.1100, 1.1200, 1.1275, 1.1300, 1.1400, 1.1500, 1.1600
Alternative Scenario: Sell Stop 1.0870. Stop-Loss 1.0950. Targets 1.0850, 1.0820, 1.0810, 1.0800, 1.0785, 1.0770, 1.0760, 1.0725, 1.0700, 1.0600, 1.0530, 1.0500, 1.0450, 1.0400, 1.0300
"Targets" correspond to support/resistance levels. This also does not mean that they will necessarily be reached, but can serve as a guide when planning and placing trading positions.


