EUR/USD

Higher Timeframes
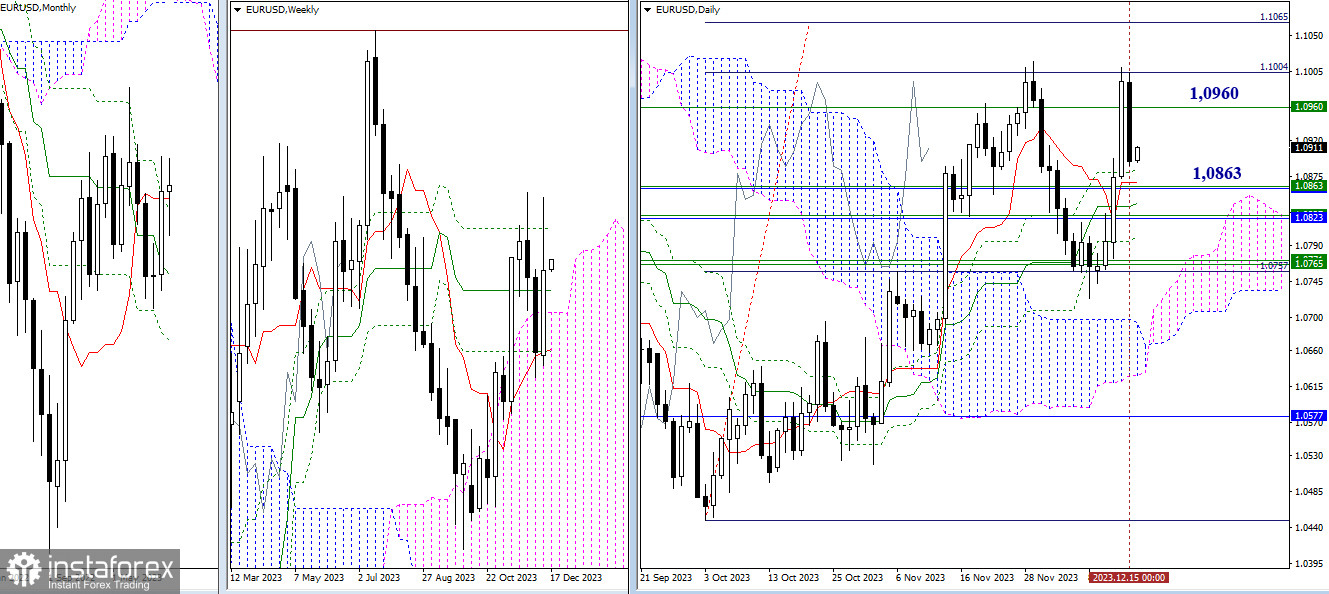
Last week, testing the first target of the day (1.1004) again took place, reinforced by the final level of the weekly cross (1.0960). However, Friday's sentiments did not allow the bulls to sustain the upward momentum, and they closed the week with a long upper shadow. As a result, the weekly level (1.0960) and the daily target (1.1004 – 1.1065) now maintain the role of the nearest upward targets. At the same time, the position of supports is also preserved today, and their passage can affect the possibilities and prospects of bearish players. Thus, we can note a fairly wide zone of 1.0862-67 (daily levels + monthly short-term trend + weekly medium-term trend) – 1.0823-27 (monthly Fibonacci Kijun + upper boundary of the weekly cloud) – 1.0765-68 (weekly levels).

H4 – H1
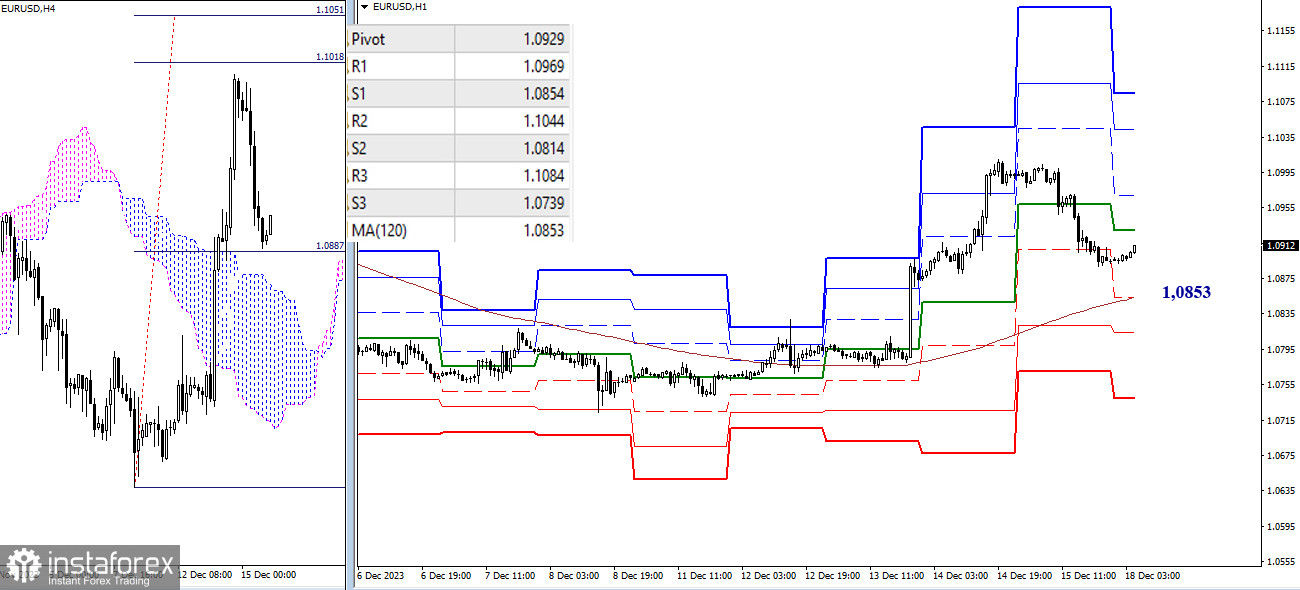
The strength of resistances from higher timeframes left the H4 target unfulfilled. Currently, on the lower timeframes, we observe a significant decline. The most important reference point capable of influencing the distribution of forces at the moment is the support of the weekly long-term trend (1.0853). A breakdown and reversal of the moving average will give the main advantage to the bears, with additional intraday supports possibly at S2 (1.0814) and S3 (1.0739).
Due to the depth of the decline, the task of restoring bullish positions is currently quite challenging. The first thing bulls will need to do is overcome the resistances of classic pivot points (1.0929 – 1.0969). Afterward, consideration can be given to exiting the correction zone (1.1010), and only then will the prospects for achieving the H4 target (1.1018-51) and opportunities to work on the next resistances of classic pivot points (1.1044 – 1.1084) reappear.
***
GBP/USD

Higher Timeframes
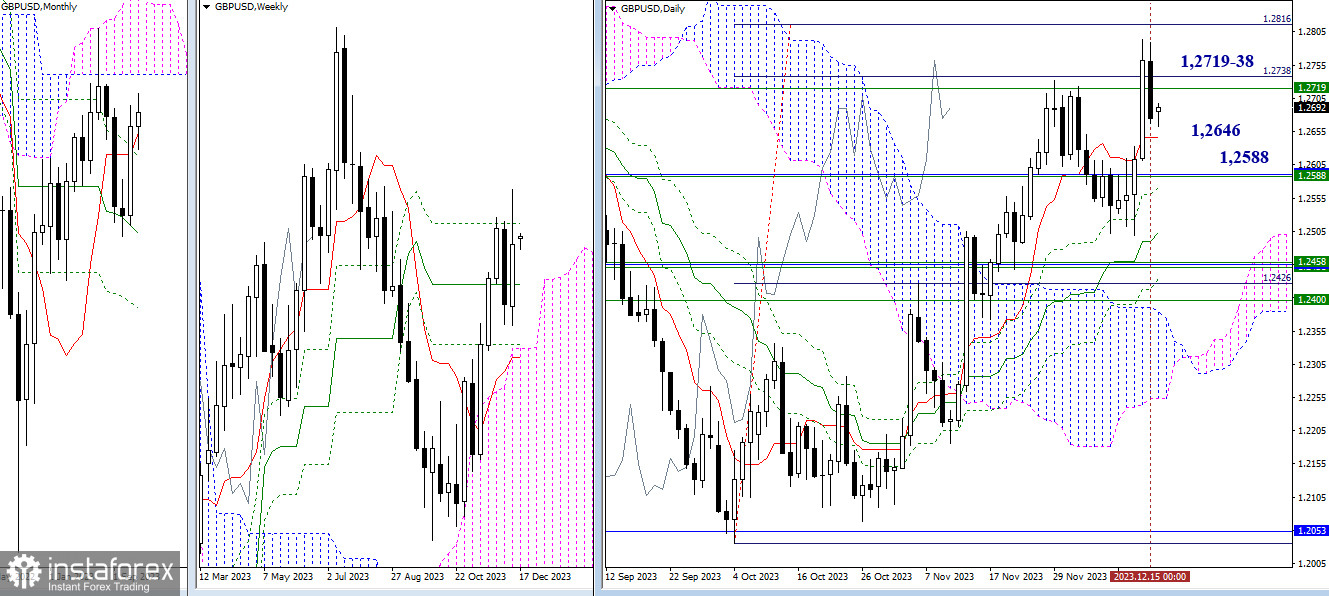
The attempt to achieve the daily targets (1.2816) last week was unsuccessful. On Friday, bulls were forced to retreat after being pressured by the opponents. The targets 1.2719-38 – 1.2816 (the final level of the weekly death cross + the daily target) are again the nearest prospects for bulls. If bears today show activity again and continue the decline, their attention may be directed to supports 1.2646 (daily short-term trend) – 1.2588 (weekly medium-term trend + monthly short-term trend).

H4 – H1
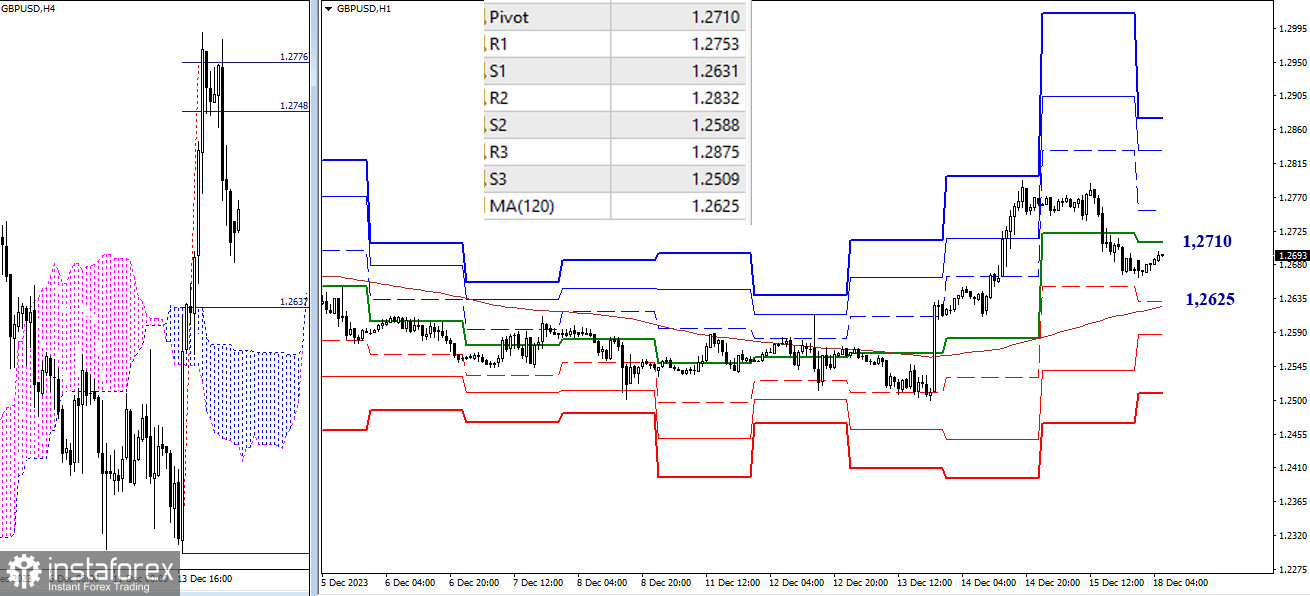
On the lower timeframes last week, the target for breaking through the H4 cloud (1.2748 – 1.2776) was worked out, but it was followed by a fairly deep corrective decline. However, the main advantage may shift in favor of bears only after breaking through and reversing the weekly long-term trend (1.2625). In this case, additional support may come from 1.2588 – 1.2509 (classic pivot points). The recovery of bullish position today is possible by passing through such references as 1.2710 – 1.2753 (classic pivot points) and 1.2793 (high), after which the resistances of classic pivot points (1.2832 – 1.2875) will serve as benchmarks.
***
The technical analysis of the situation uses:
Higher timeframes - Ichimoku Kinko Hyo (9.26.52) + Fibonacci Kijun levels
Lower timeframes - H1 - Pivot Points (classic) + Moving Average 120 (weekly long-term trend)


