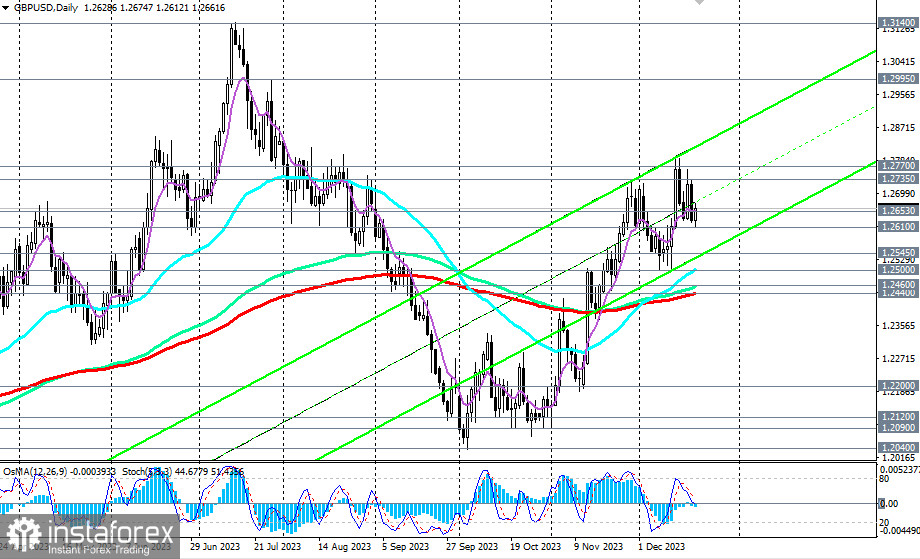
GBP/USD lost 0.74% on Wednesday, dropping by 94 points to 1.2630. But despite this, the pair maintains a positive medium-term dynamics, moving within an upward channel on the daily price chart on Thursday.
As of writing, GBP/USD was trading near the level of 1.2660, in the zone of the medium-term bullish market—above the key support level of 1.2440 (200 EMA on the daily chart).

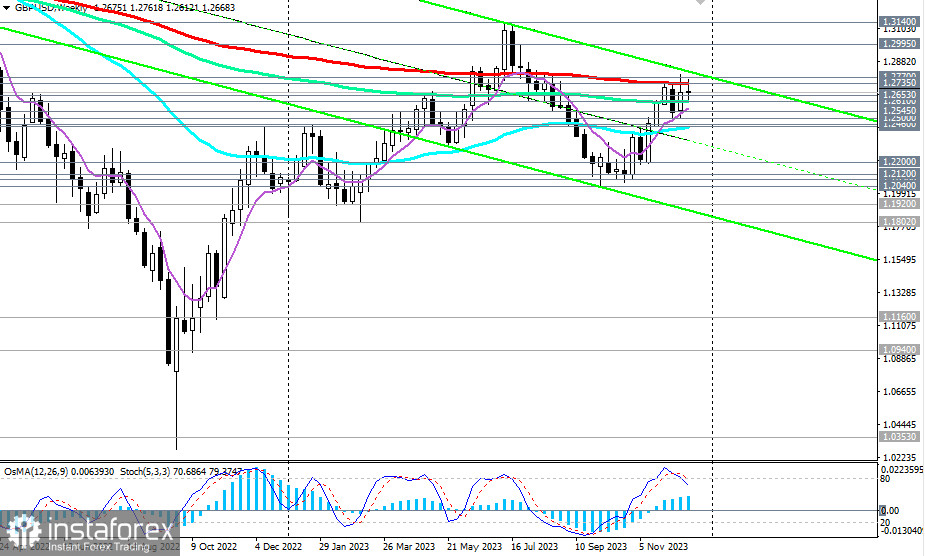
However, for a breakthrough into the zone of the long-term bullish market, the price needs to overcome the key resistance levels of 1.2735 (200 EMA on the weekly chart) and 1.2770 (50 EMA on the monthly chart).
So far, as we can see, the price has not been able to do this, despite the fact that GBP/USD has made several attempts to break through this month.
If, however, the price does break these resistance levels, GBP/USD will open up what is called an operational space and targets near local resistance levels of 1.3000 and 1.3140 with the prospect of further growth.
However, here, the primary role will still be played by the dynamics of the dollar. If its weakening soon stops, an alternative scenario will come into force: after breaking the important long-term support level of 1.2610 (144 EMA on the weekly chart), GBP/USD will head into the downward channel on the weekly chart towards the key medium-term support level of 1.2440 (200 EMA on the daily chart).
Its breakdown, in turn, will mean a transition into the zone of the medium-term bearish market and a resumption of the long-term downward trend.
Note that the technical indicators OsMA and Stochastic on the daily chart have shifted to the sellers' side, and on the weekly chart, they are also turning towards short positions.

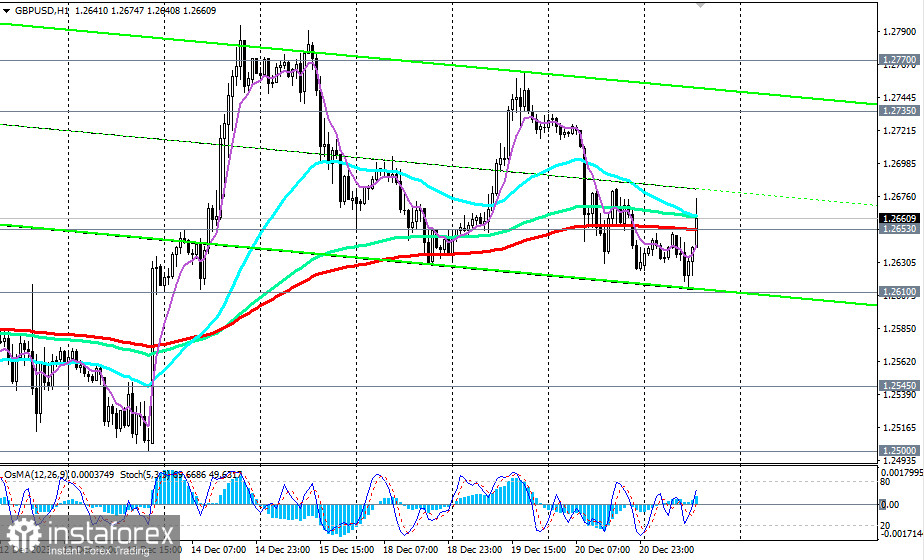
In the short and medium term, especially if U.S. GDP and labor market data on Thursday disappoint dollar buyers, we expect GBP/USD to rise. The breakout of the local resistance level 1.2680 (after breaking the short-term support level of 1.2653—200 EMA on the 1-hour chart) can be a signal for this growth.
Support levels: 1.2653, 1.2610, 1.2600, 1.2545, 1.2500, 1.2460, 1.2440, 1.2400
Resistance levels: 1.2680, 1.2700, 1.2735, 1.2770, 1.2800, 1.2900, 1.2995, 1.3100, 1.3140, 1.3200
Trading scenarios
Main scenario: Buy Stop 1.2685. Stop-Loss 1.2610. Targets 1.2700, 1.2735, 1.2770, 1.2800, 1.2900, 1.2995, 1.3100, 1.3140, 1.3200
Alternative scenario: Sell Stop 1.2610. Stop-Loss 1.2685. Targets 1.2600, 1.2545, 1.2500, 1.2460, 1.2440, 1.2400, 1.2300, 1.2200, 1.2120, 1.2100, 1.2090, 1.2040, 1.2000
"Targets" correspond to support/resistance levels. This also does not mean that they will necessarily be reached, but they can serve as a guide when planning and placing your trading positions.


