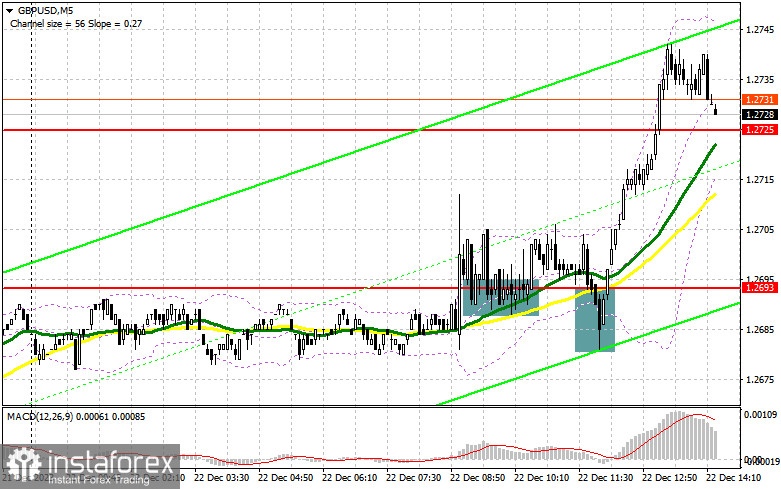
In my morning forecast, I drew attention to the level of 1.2693 and planned to decide to enter the market based on it. Let's look at the 5-minute chart and analyze what happened there. The breakout and the subsequent test of 1.2693 allowed for a buy signal for the pound, resulting in a pair's rise of more than 30 points. For the second half of the day, the technical picture was reassessed.

To open long positions on GBP/USD, the following is required:
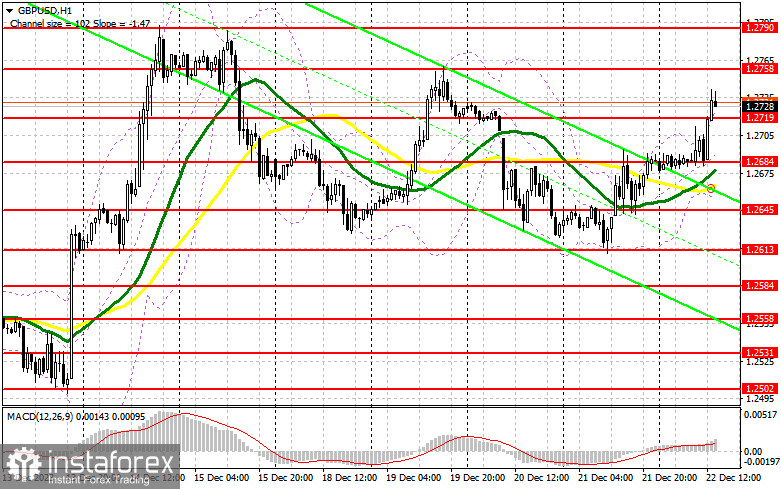
Pound buyers ignored the revised downward GDP data for the third quarter in the UK, actively increasing positions ahead of the quite interesting US data. There are many indicators ahead, but the most interesting will be the figures for the core Personal Consumption Expenditure (PCE) index – the Federal Reserve's preferred inflation gauge- and changes in US consumer spending and income. Good figures for home sales in the primary market will be a bonus. In the case of weak inflation, the pound will continue to rise, while poor indicators, including the real estate market, will lead to a correction in the pair, where buyers should come into play. I expect their activity around 1.2719 is missing, which could cause significant problems. The formation of a false breakout there will lead to a suitable entry point for long positions with the aim of further movement to the area of 1.2758, which was not reached in the first half of the day. A breakout and consolidation above this range will lead to the removal of bear stop orders and a more pronounced pound rise to 1.2790. The maximum target will be 1.2820, where I will take profit. A fairly active decline in the pound may begin in the scenario of a pair's decline and the absence of bullish activity at 1.2719 in the second half of the day. In this case, only a false breakout in the area of the next support at 1.2684 will allow considering opening long positions. I plan to buy GBP/USD immediately on the rebound only from 1.2645, with the target of a correction within the day by 30-35 points.
To open short positions on GBP/USD, the following is required:
Sellers are not particularly eager to return to the market, and only a very strong rise in the PCE index will lead to an increase in short positions at the end of the week. In the case of a bullish reaction to the data, the primary task will be to protect the resistance at 1.2758, where the formation of a false breakout will be a suitable entry point for selling the pound with the aim of a decline to the new support at 1.2719, formed as a result of the first half of the day. A breakout and reverse test from the bottom to the top of this range will remove stop orders, opening the way to 1.2684, where moving averages are located. A more distant target will be the area of 1.2645, where I will take profit. In the scenario of GBP/USD growth and the absence of activity at 1.2758 in the second half of the day, buyers can expect further development of the bullish market. In this case, I will postpone sales until a false breakout at 1.2690. Without downward movement, I will sell GBP/USD immediately on the rebound from 1.2820, but only with the expectation of a pair's correction down by 30-35 points within the day.

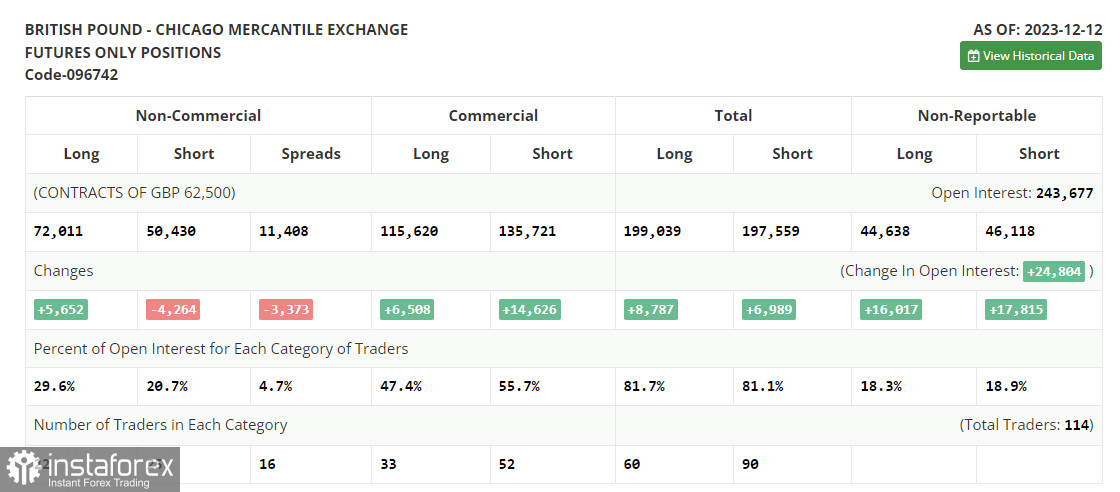
In the Commitments of Traders (COT) report for December 12, there was a sharp increase in long positions and a decrease in short ones. Demand for the pound persists, as the recent decision of the Bank of England to keep rates unchanged in anticipation of further combat with high inflation, along with Bank of England Governor Andrew Bailey's statements that rates will remain high for an extended period – all of this has revived the pound and led to its strengthening against the US dollar. The question is how the UK economy, facing significant difficulties lately, will react to all this. In the near future, a batch of inflation data for the UK and the US will be released, and in case of rising prices, one can count on further strengthening the pair. In the latest COT report, it is stated that long non-commercial positions increased by 5,652 to the level of 72,011, while short non-commercial positions fell by 4,264 to the level of 50,430. As a result, the spread between long and short positions decreased by 3,373.

Indicator signals:
Moving averages
Trading is conducted above the 30 and 50-day moving averages, indicating further pound growth.
Note: The author considers the periods and prices of moving averages on the hourly chart (H1) and differs from the general definition of classic daily moving averages on the daily chart (D1).
Bollinger Bands
In case of a decrease, the lower boundary of the indicator will act as support around 1.2655.
Description of indicators:
- Moving Average (MA) - determines the current trend by smoothing volatility and noise. Period 50. Marked on the chart in yellow.
- Moving Average (MA) - determines the current trend by smoothing volatility and noise. Period 30. Marked on the chart in green.
- Moving Average Convergence Divergence (MACD) - Fast EMA period 12, Slow EMA period 26, SMA period 9.
- Bollinger Bands - a volatility indicator consisting of a SMA and two standard deviations. Period 20.
- Non-commercial traders are speculators, such as individual traders, hedge funds, and large institutions, who use the futures market for speculative purposes and meet specific requirements.
- Long non-commercial positions represent the total long open positions of non-commercial traders.
- Short non-commercial positions represent the total short open positions of non-commercial traders.
- The total non-commercial net position is the difference between the short and long positions of non-commercial traders.


