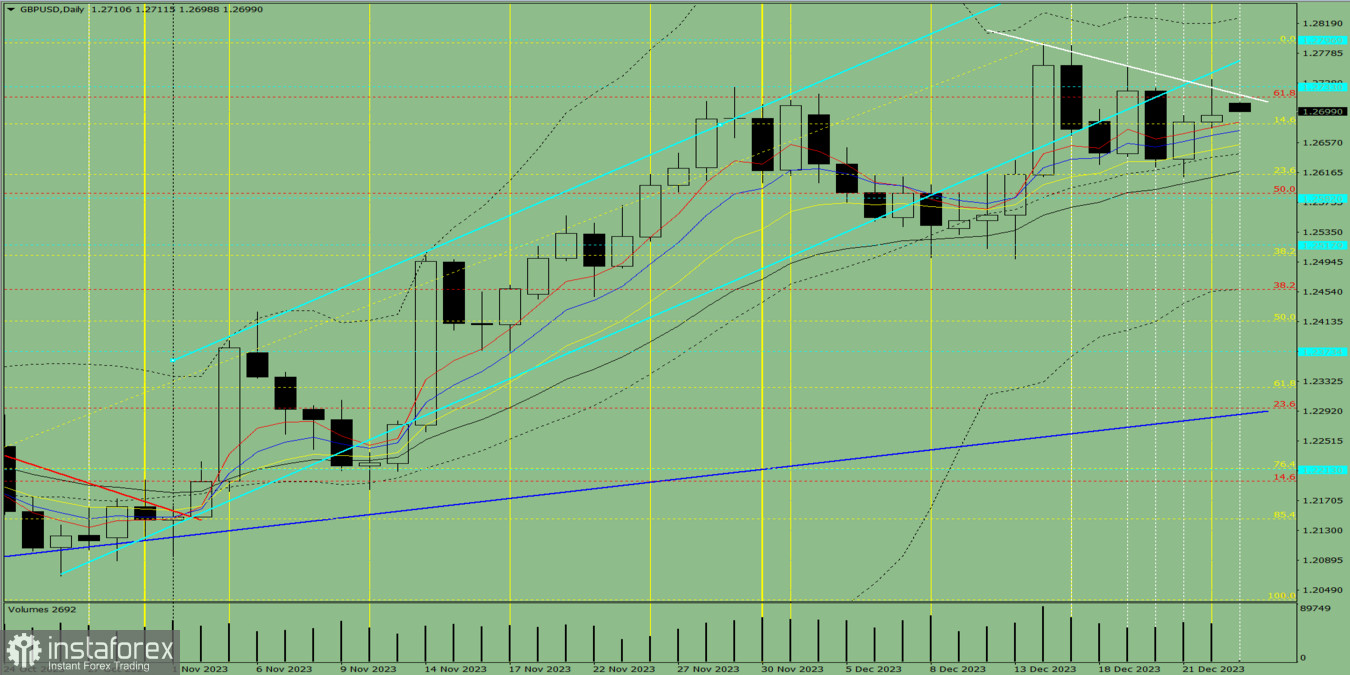
Trend analysis (Fig. 1)
GBP/USD may continue its upward movement, rising from the level of 1.2694 (closing of Friday's daily candle) and testing the resistance line at 1.2768 (bold blue line). Upon reaching this, the pair may bounce back to the historical support level at 1.2733 (blue dashed line).

Fig. 1 (daily chart)
Comprehensive analysis:
Indicator analysis - uptrend
Volume - uptrend
Candlestick analysis - uptrend
Trend analysis - uptrend
Bollinger bands - uptrend
Weekly chart - uptrend
Conclusion: From the level of 1.2694 (closing of Friday's daily candle), GBP/USD will climb upwards and test the resistance line at 1.2768 (bold blue line). Following this could be a rebound to the historical support level at 1.2733 (blue dashed line).
Alternatively, there may be a decline from 1.2694 (closing of Friday's daily candle) to the 14.6% retracement level of 1.2682 (yellow dashed line). Upon reaching this, the pair will rise and test the historical resistance level at 1.2797 (blue dashed line).


