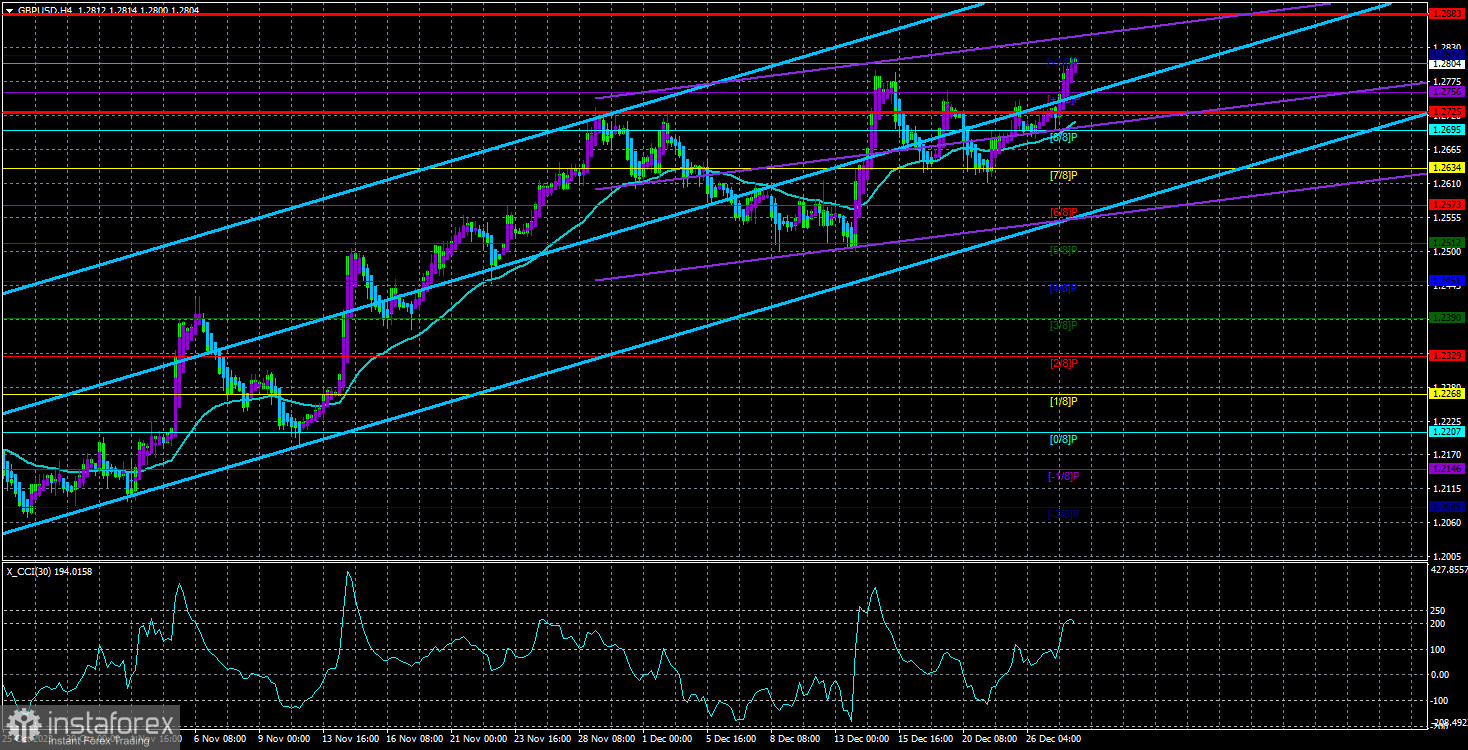
As banal as it may sound, the currency pair GBP/USD on Tuesday also showed an upward movement. During the day (from its minimum), the pair gained more than 60 points. We want to remind you that such movements are not always observed, even on days with statistics and fundamentals. However, now, when there is neither news nor events, the market finds reasons for a new batch of purchases of the British currency.
First, let's address an important factor to understand the situation better. Even if all fundamentals and macroeconomics point in one direction, any instrument can move in the opposite direction because, regardless of the news, the market can make decisions based on its perspective. Besides, there are major players in the market who make significant transactions. They do so to acquire the necessary amount of a particular currency for their operations rather than for profit. Therefore, we look at a certain pair with the goal of "buying low, selling high," while large banks and companies simply buy a particular currency because they need it at that time.
For this reason, movements may not always align with the results and conclusions of any analysis. This is because everything depends on the preferences of most market participants, not on indicators, waves, or macroeconomic reports. Suppose a large company urgently needs to buy 1 billion euros for future transactions with European companies. Does the GDP level in the US versus the European Union matter to them at the moment? They enter the market to buy the required amount of currency. Demand increases, and the currency appreciates. How can one predict such growth? You can't because large players need to inform us about their actions.
Therefore, occasionally, we find ourselves in situations where it is impossible to explain clearly why a particular currency or asset is rising. Why, for example, has Bitcoin been rising for the past 15 years? Is it because humanity can't live without it? Or is it a profitable alternative to fiat money and the banking system? No, it's just an investment instrument, about 75% of which is already owned by major investors. A slight increase in demand from these same investors leads to a new rise in the cryptocurrency, even though there are no grounds for new asset purchases. It grows because it is being bought.
The same goes for the pound right now. We are still determining who currently needs so much British currency, but if it's appreciating, it means there's an increased demand for it. Explaining why demand is rising is impossible; it's increasing without reason. Recall that the British economy has not been in its best shape since 2016. Of course, it's the British economy, not Zimbabwe's. "Bad" in Britain is much better than "good" in Zimbabwe. But at the same time, there is the American economy, where things are going much better, deposit rates are higher, and government bond yields are higher.
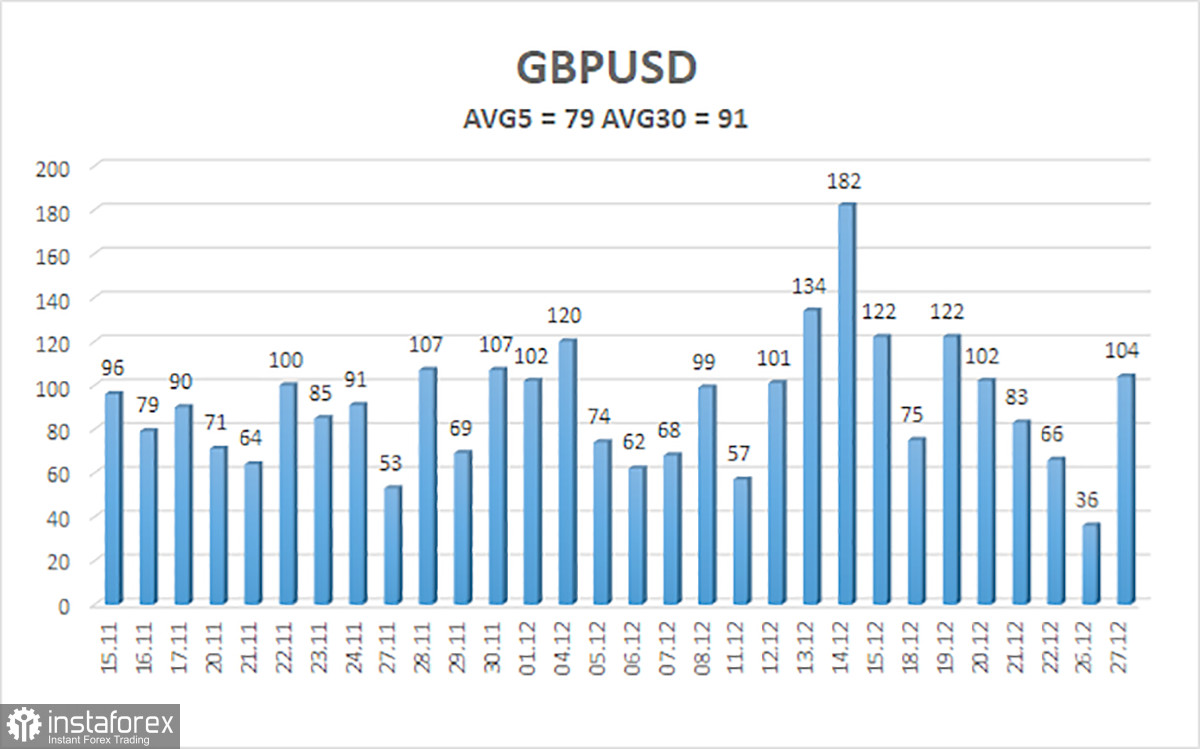
The average volatility of the GBP/USD pair over the last five trading days as of December 28 is 79 points. For the GBP/USD pair, this value is considered "average." Therefore, on Thursday, December 28, we expect the pair to move within the range limited by the levels of 1.2725 and 1.2883. A downward reversal of the Heiken Ashi indicator will indicate a new phase of corrective movement.
Nearest support levels:
S1 - 1.2756
S2 - 1.2695
S3 - 1.2634
Nearest resistance levels:
R1 - 1.2817
Trading recommendations:
The GBP/USD currency pair stays above the moving average line, but its growth raises many questions. Traders can consider long positions since the technical picture completely favors the bulls. However, during the current week, volatility may be very low, which should be kept in mind. Long positions can be maintained, with targets at 1.2817 and 1.2883, until the price consolidates below the moving average. Short positions will become reasonable if the price consolidates below the moving average, with targets of 1.2634 and 1.2573. Exit the market in the event of the first signs of a flat.
Explanations for the illustrations:
Linear regression channels - help determine the current trend. If both point in the same direction, the trend is currently strong.
The moving average line (settings 20.0, smoothed) - determines the short-term trend and the direction in which trading should be conducted.
Murray levels - target levels for movements and corrections.
Volatility levels (red lines) - the likely price range the pair will move in the next day based on current volatility indicators.
CCI indicator - its entry into the oversold area (below -250) or overbought area (above +250) indicates an impending trend reversal in the opposite direction.


