


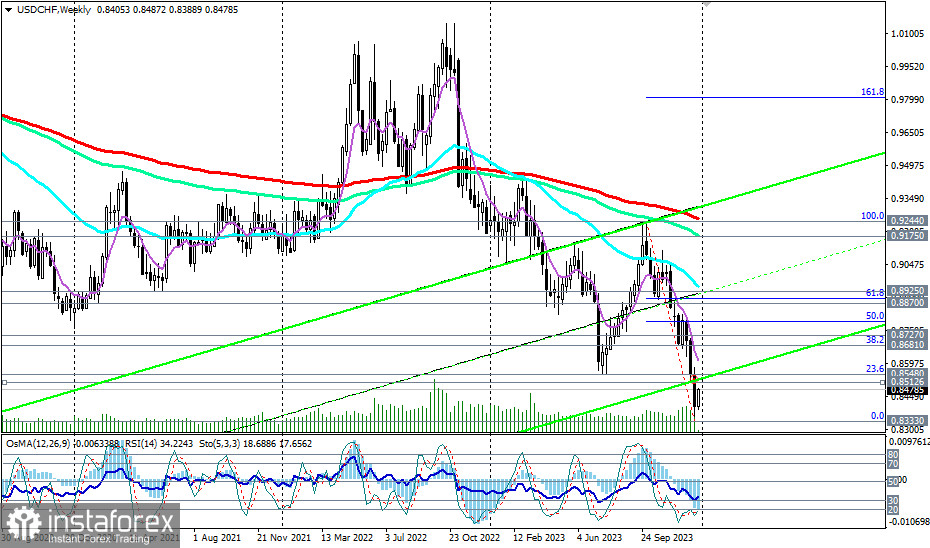
Over the past three months, USD/CHF has lost about 9% in value, reaching a multi-year low of 0.8333 at the end of December.
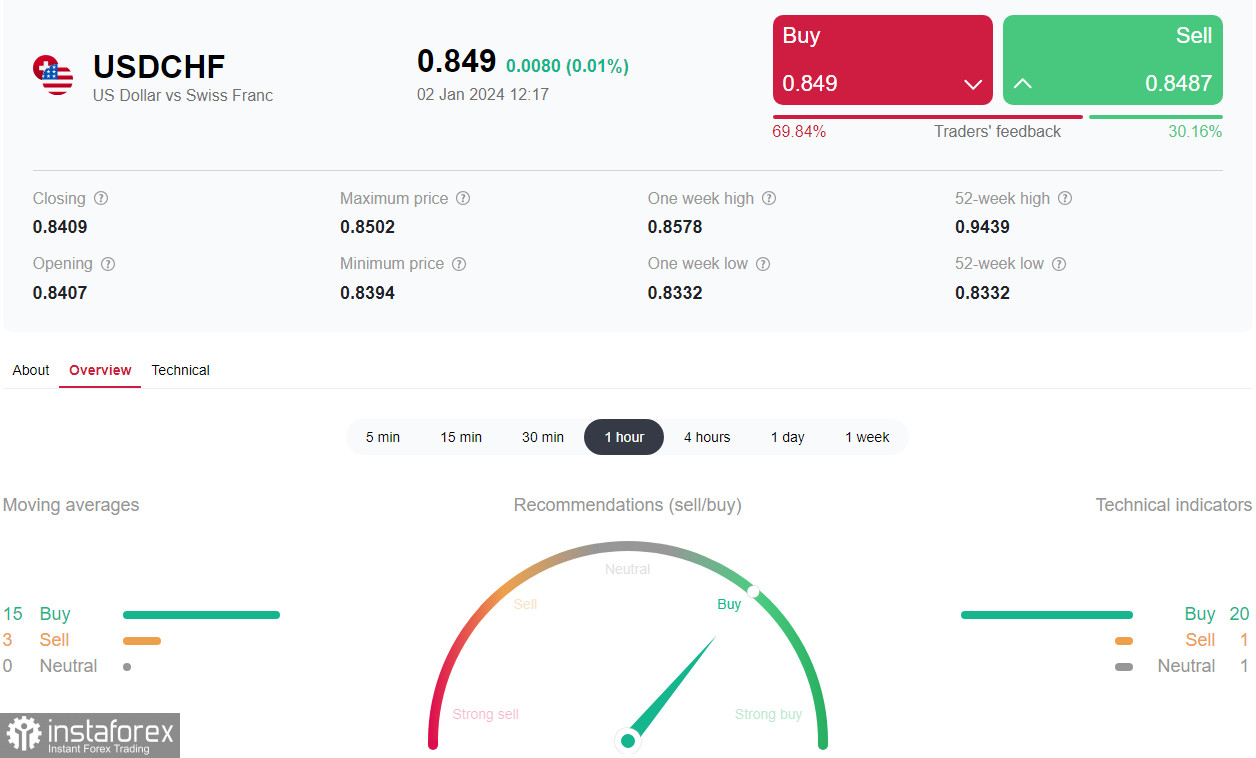
Today, USD/CHF is growing, primarily due to the strengthening of the U.S. dollar, which is receiving support from the escalation of geopolitical tensions in the Middle East.
However, despite today's growth, USD/CHF maintains a long-term downward trend, trading in the zone of long-term and medium-term bear markets—below the key resistance levels of 0.9250 (200 EMA on the weekly chart), 0.8925 (200 EMA on the daily chart).
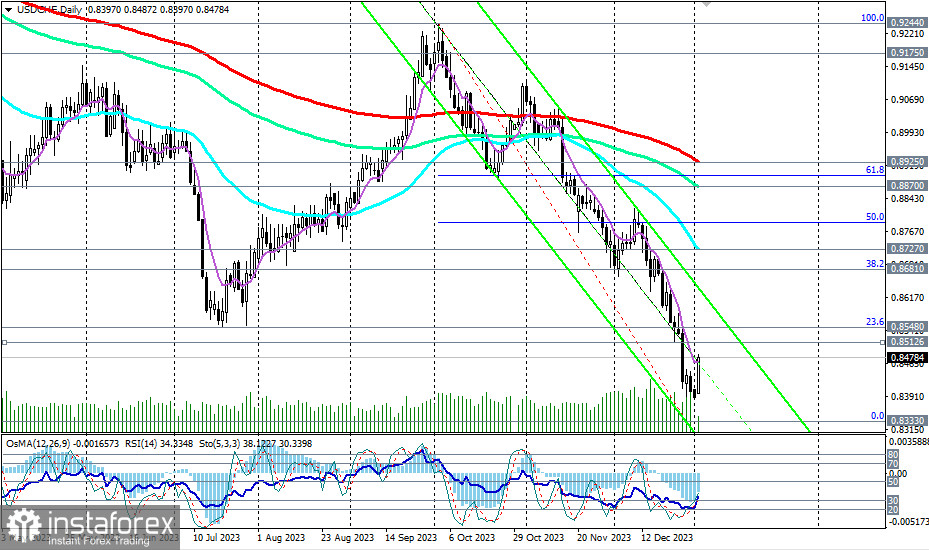
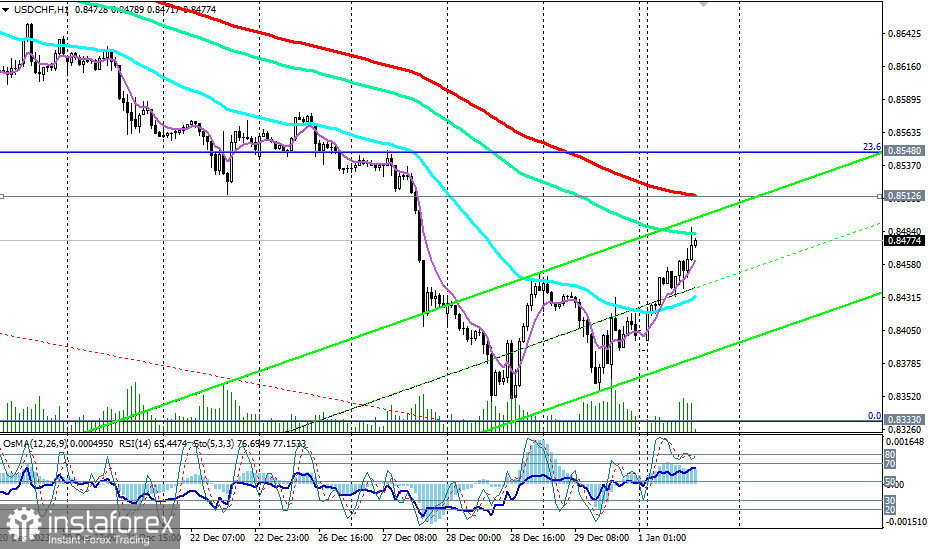
The nearest significant resistance levels are located at 0.8512 (200 EMA on the 1-hour chart), 0.8548 (the 23.6% Fibonacci level of the upward correction to the decline wave that began in October 2023 near the 0.9244 mark).
Considering the long-term downward trend, it is logical to assume a rebound near these levels and a return to the downward trend. A breakdown of today's low of 0.8397 will confirm this assumption. Note that in August 2011, the pair reached a record low near the 0.7100 mark.
In an alternative scenario and in case of a successful attempt to break through resistance levels 0.8512, 0.8548, the corrective price growth may continue up to the important short-term resistance level of 0.8681 (200 EMA on the 4-hour chart and the 38.2% Fibonacci level).
But this is still not a long-term or even medium-term upward trend. It may form after a steady rise into the zone above key medium-term resistance levels 0.8925 (200 EMA on the daily chart), 0.8950 (50 EMA on the weekly chart).
However, only a breakout of the key resistance level of 0.9250 (200 EMA on the weekly chart) will bring USD/CHF into the zone of a long-term bull market, and a breakout of the resistance level of 1.0240 (200 EMA on the monthly chart)—into the zone of a global bull market.
For now, despite today's growth, short positions remain preferable for USD/CHF. A breakdown of the short-term support at 0.8435 (200 EMA on the 15-minute chart) may be the first signal for resuming short positions.
Support levels: 0.8435, 0.8400, 0.8330, 0.8300, 0.8200
Resistance levels: 0.8512, 0.8548, 0.8600, 0.8681, 0.8700, 0.8727, 0.8800, 0.8870, 0.8896, 0.8900, 0.8925
Trading scenarios
Main scenario: Sell Stop 0.8430. Stop-Loss 0.8520. Targets 0.8400, 0.8330, 0.8300, 0.8200
Alternative scenario: Buy Stop 0.8520. Stop-Loss 0.8430. Targets 0.8548, 0.8600, 0.8681, 0.8700, 0.8727, 0.8800, 0.8870, 0.8896, 0.8900, 0.8925
"Targets" correspond to support/resistance levels. This also does not mean that they will necessarily be reached, but can serve as a reference point when planning and placing your trading positions.


