Analysis of EUR/USD 5M

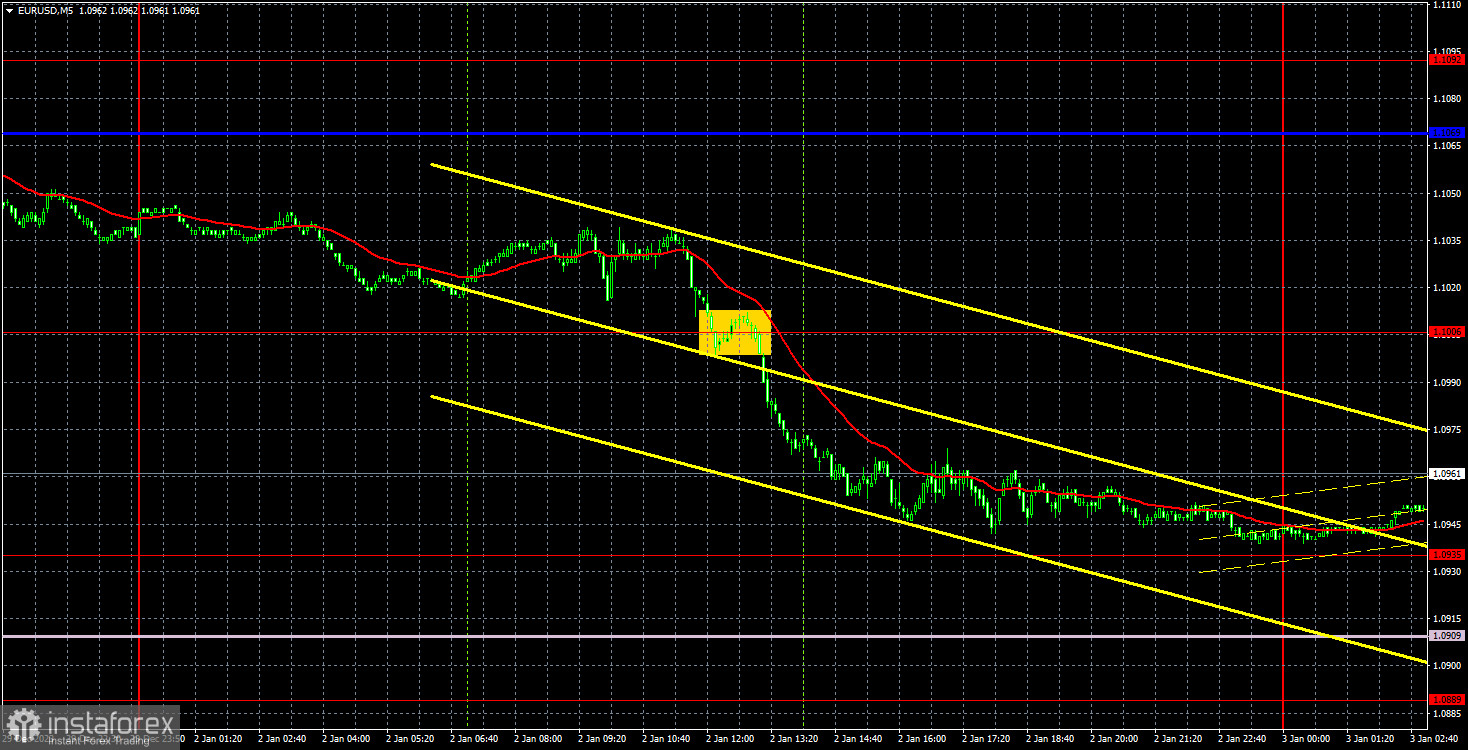
EUR/USD fell by about 100 pips seemingly out of nowhere. While this decline may appear unexpected, we have repeatedly mentioned that the euro is significantly overbought and is unjustifiably expensive in dollar terms. Therefore, the decline had been looming for several weeks at the very least.
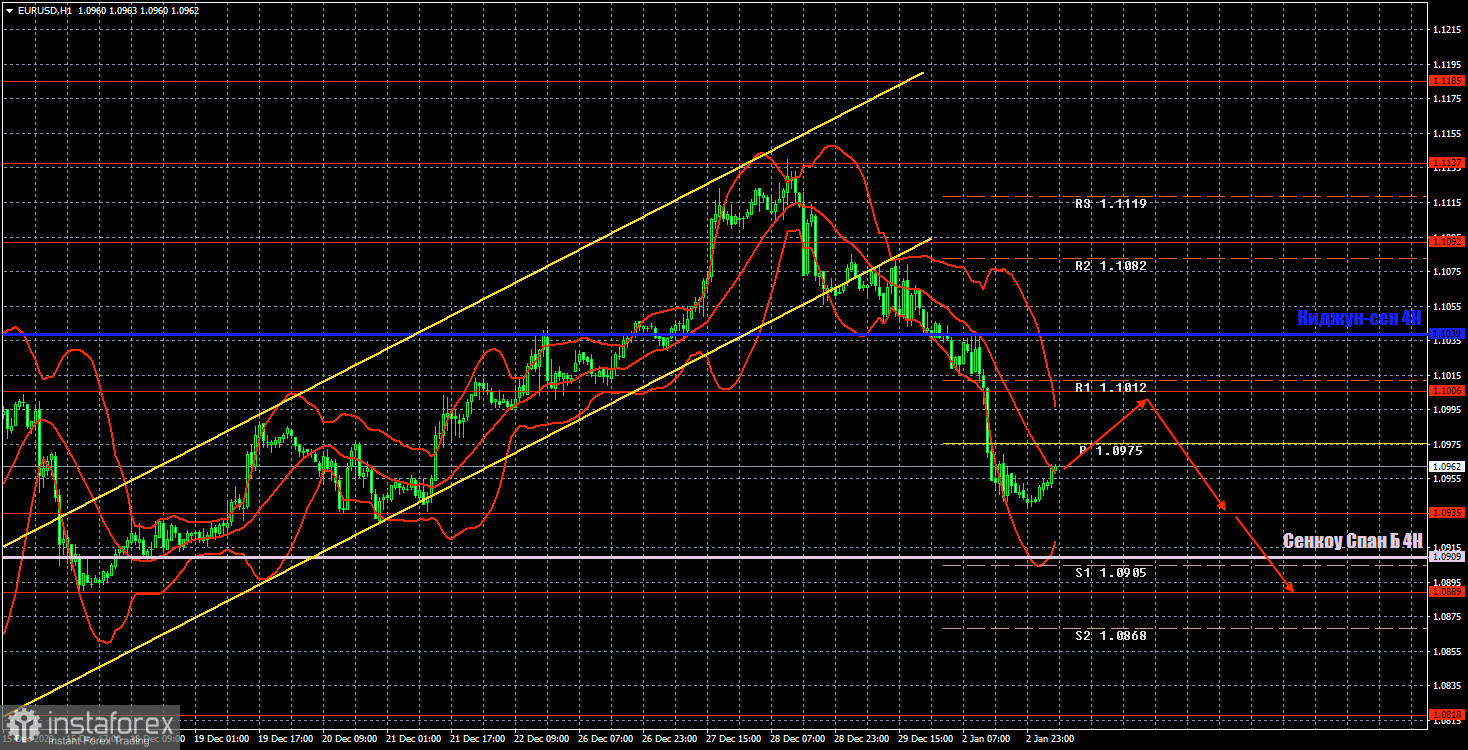
The market didn't waste any time and started selling on the very first day of the new year. This doesn't necessarily mean that the pair will continue to fall, although from our perspective, this would be the most logical outcome. The pair breached the ascending channel, signaling the end of the uptrend. At the very least, the pair should experience a significant bearish correction. Currently, the price hasn't reached the Senkou Span B line, but if it does breach this line, the likelihood of the euro's decline will increase significantly.
We still believe that it is quite realistic for the price to drop to the $1.02 level. It's important to remember that the recent upward movement was merely a correction. When a correction ends, the trend resumes. The 24-hour timeframe shows a downtrend. Therefore, we expect the pair to trade lower.
In terms of macro data on Tuesday, we can only highlight the Manufacturing PMI data of Germany and the EU. Since these were the second estimates for December, there was no need to expect any significant reaction to these reports. It's safe to say that these reports did not trigger the 100-pip drop.
In regards to trading signals, only one was generated around the 1.1006 level yesterday. Subsequently, the price continued to drop and nearly reached the 1.0935 level. In any case, profit-taking for short positions should have occurred around this level. The profit amounted to at least 40-45 pips, which is quite decent.
COT report:

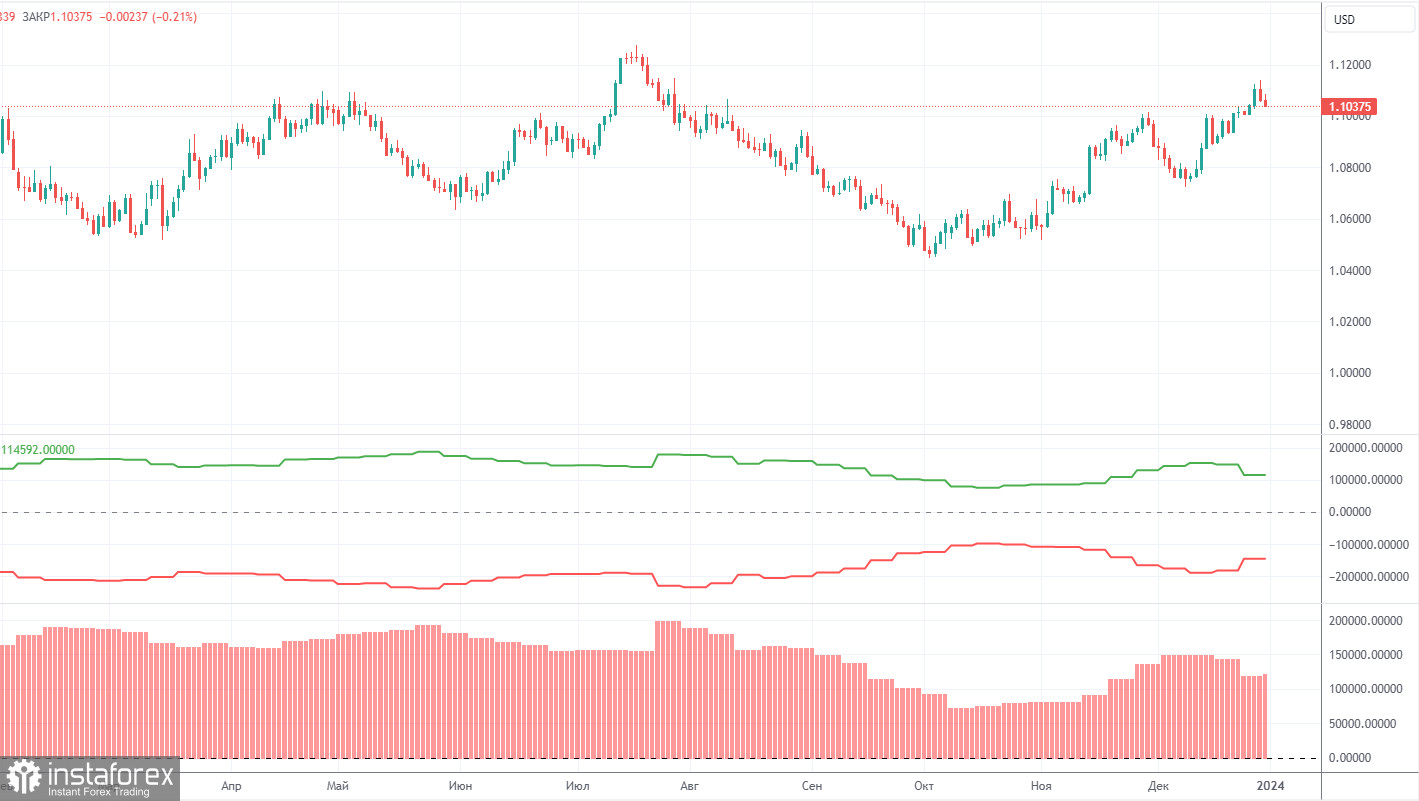
The latest COT report is dated December 26. In the first half of 2023, the net position of commercial traders hardly increased, but the euro remained relatively high during that period. Then, the euro and the net position both went down for several months, as we anticipated. However, in the last few weeks, both the euro and the net position have been rising. Therefore, we can conclude that the pair is correcting higher, but the corrections cannot last forever because they are just corrections.
We have previously noted that the red and green lines have moved significantly apart from each other, which often precedes the end of a trend. Currently, these lines are moving apart again. Therefore, we support the scenario where the euro should fall and the upward trend must end. During the last reporting week, the number of long positions for the non-commercial group increased by 3,100, while the number of short positions increased by 300. Consequently, the net position increased by 2,800. The number of buy contracts is still higher than the number of sell contracts among non-commercial traders by 118,000. The gap is significant, and even without COT reports, it is evident that the euro should continue to fall.
Analysis of EUR/USD 1H

On the 1-hour chart, EUR/USD has settled below the Kijun-sen line and the channel, which suggests the possibility of a new downtrend. The first target appears to be the Senkou Span B line. From our perspective, the US dollar has been oversold for the past month, and the next logical step is for it to move upwards (i.e., downwards for the EUR/USD pair).
Today, we consider it reasonable to look for a small bullish rebound. It's unlikely that the pair will experience a sharp decline for two consecutive days. However, we would like to remind you that a good amount of important US data will be released this week, which could either support or put pressure on the dollar. In the event of a rebound from the 1.1006 level or a consolidation below 1.0935, you can consider short positions while aiming for the Senkou Span B line, and levels like 1.0889,1.0818.
On January 3, we highlight the following levels for trading: 1.0658-1.0669, 1.0757, 1.0818, 1.0889, 1.0935, 1.1006, 1.1092, 1.1137, 1.1185, 1.1234, 1.1274, as well as the Senkou Span B line at 1.0909 and the Kijun-sen at 1.1039. The Ichimoku indicator lines can shift during the day, so this should be taken into account when identifying trading signals. Don't forget to set a breakeven Stop Loss if the price has moved in the intended direction by 15 pips. This will protect you against potential losses if the signal turns out to be false.
On Wednesday, there are no interesting data planned for the European Union. From the US docket, we can look forward to two reports: JOLTs and the ISM index. In the evening, the minutes of the last Federal Reserve meeting will be released. These three events could trigger a strong market reaction.
Description of the chart:
Support and resistance levels are thick red lines near which the trend may end. They do not provide trading signals;
The Kijun-sen and Senkou Span B lines are the lines of the Ichimoku indicator, plotted to the 1H timeframe from the 4H one. They provide trading signals;
Extreme levels are thin red lines from which the price bounced earlier. They provide trading signals;
Yellow lines are trend lines, trend channels, and any other technical patterns;
Indicator 1 on the COT charts is the net position size for each category of traders;
Indicator 2 on the COT charts is the net position size for the Non-commercial group.


