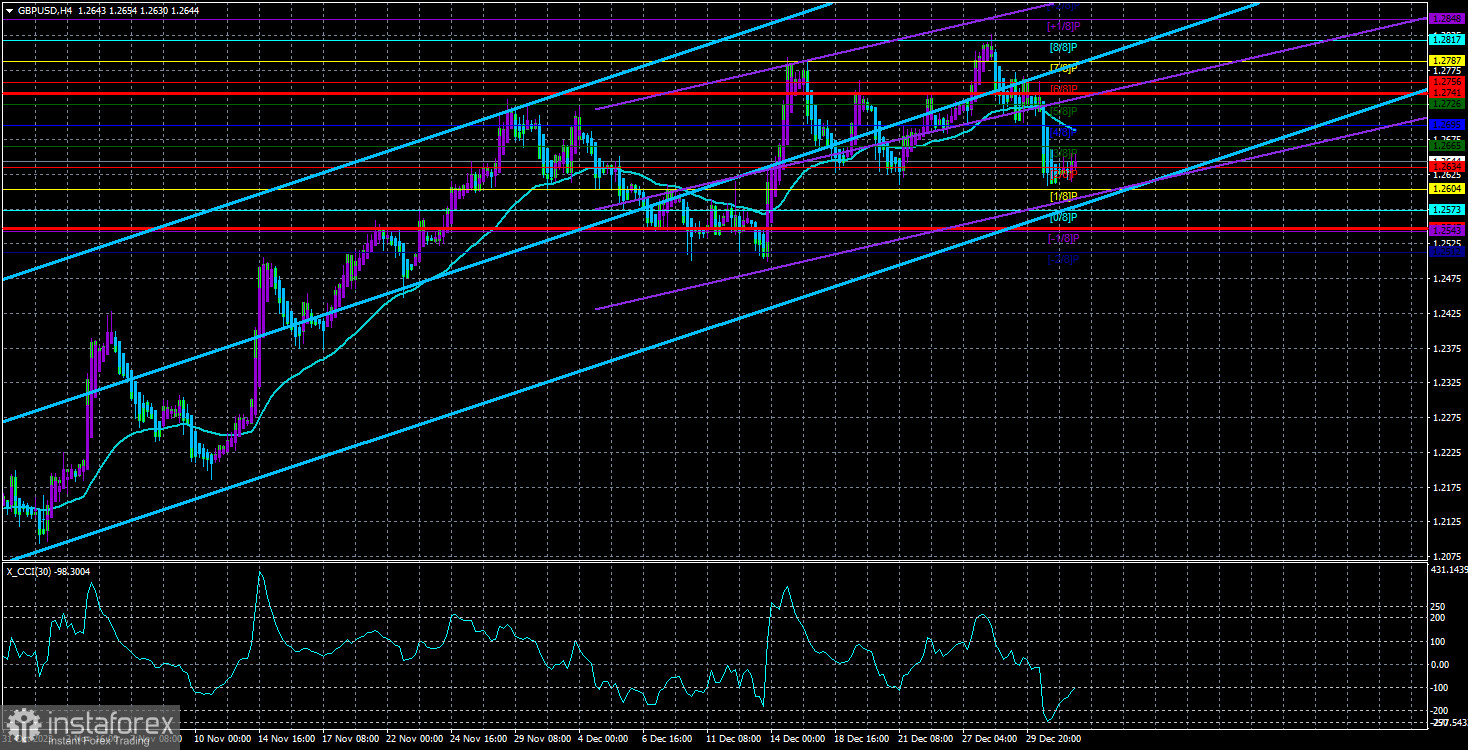
Yesterday, the GBP/USD pair maintained the same momentum it started in the new year. The price is still below the moving average line, making it possible for us to anticipate a decline, at least to the previous local low, which is located around the "Murray -2/8" level at 1.2512. There is not much left until it hits this mark, but until we confirm that it actually breaks through this, we believe that the pair still has a chance to bring back the illogical upward trend.
We have to remind you that the pound's current growth is essentially a correction. If we switch to the 24-hour timeframe, we can see that the previous decline was more significant, so the current upward movement is simply a correction. Now is a good time for it to end. And if that's the case, the pound will continue to fall for a very long time.
However, you shouldn't ignore the economic reports either. It is hardly a secret that in November and December, economic data significantly dampened the outlook for the US dollar. The pair fell during those months, but the US data stopped providing support to the pair, and the market simply ignored the optimistic reports. Therefore, if we witness weak data again this week, the pair may stop falling altogether.
What is so important this week and what should be the primary focus? All the most important reports will be published on Friday, and there will be three of them at once.
NonFarm Payrolls: This report stands out among all the indicators of the US economy. Last month, we learned that 199,000 new jobs were created in November. By the end of December, the figure may decrease to 150-168,000, but it's important to remember that there are always significant deviations when it comes to this indicator, both higher and lower than expected. For instance, with a forecast of 150,000, it's entirely possible to see a figure of 250,000 or the opposite.
Unemployment Rate: A less important indicator. The unemployment rate is expected to increase to 3.8-3.9% by the end of December, which shouldn't be a surprise but could slightly dampen sentiment. The market will primarily focus on NonFarm Payrolls. If they turn out to be positive, the unemployment report won't carry significant weight. It will serve as confirmation for the NonFarm Payrolls. A strong value in the first report plus a strong value in the second one could push the dollar to gain 100 pips in just a few hours.
ISM Non-Manufacturing PMI: This week, we've already seen the ISM index for the manufacturing sector, but the services sector is even more important now. This indicator remains above the 50.0 level, and we don't expect a significant decline from December. The ISM report can either strengthen or weaken trader sentiment, depending on what has already been published regarding unemployment and NonFarm Payrolls. If it also turns out to be positive, the dollar will likely rise. Of course, it's unlikely that all three reports will be uniformly positive or negative. So, maybe we shouldn't expect a major drop or a rally. However, these reports can help the dollar establish a basis for further medium-term growth, which is crucial.

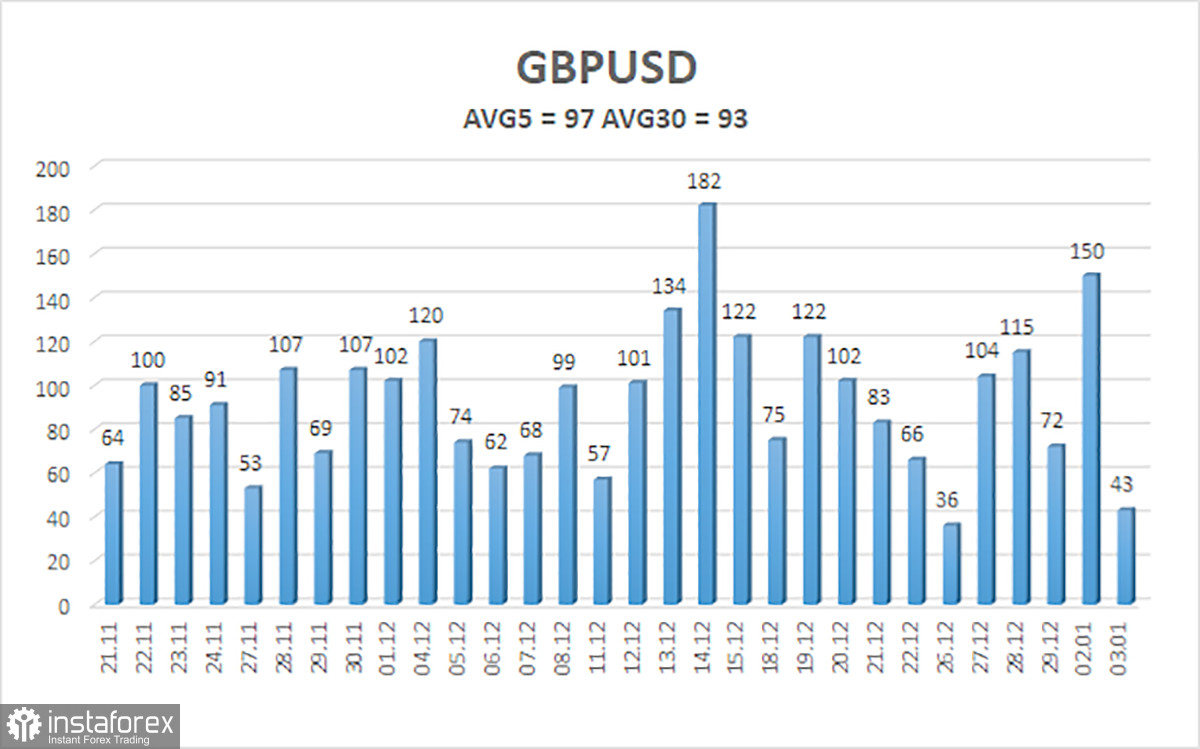
The average volatility of the GBP/USD pair over the last five trading days has been 97 pips. This is considered an "average" value for the pair. Therefore, we expect the pair to move within a range defined by the levels 1.2547 and 1.2741. A bullish reversal of the Heiken Ashi indicator would indicate a potential new upswing in the uptrend.
Nearest support levels:
S1 - 1.2604
S2 - 1.2573
S3 - 1.2543
Nearest resistance levels:
R1 - 1.2634
R2 - 1.2665
R3 - 1.2695
Trading recommendations:
The GBP/USD pair has settled below the moving average, and the next logical step is for it to fall further. Currently, we consider it appropriate to consider new short positions or maintain existing ones with targets at 1.2543 and 1.2523. You can consider long positions after a reverse consolidation above the moving average with targets at 1.2741 and 1.2787.
Description of the chart:
Linear Regression Channels: They help determine the current trend. If both are pointing in the same direction, it indicates a strong trend.
Moving Average Line (settings 20,0, smoothed): It identifies the short-term trend and the direction in which trading should currently be conducted.
Murray Levels: Target levels for movements and corrections.
Volatility levels (red lines): The probable price channel in which the pair will move over the next day, based on current volatility indicators.
CCI Indicator: Its entry into the overbought territory (above +250) or oversold territory (below -250) signals an approaching trend reversal in the opposite direction.


