Analysis of EUR/USD 5M

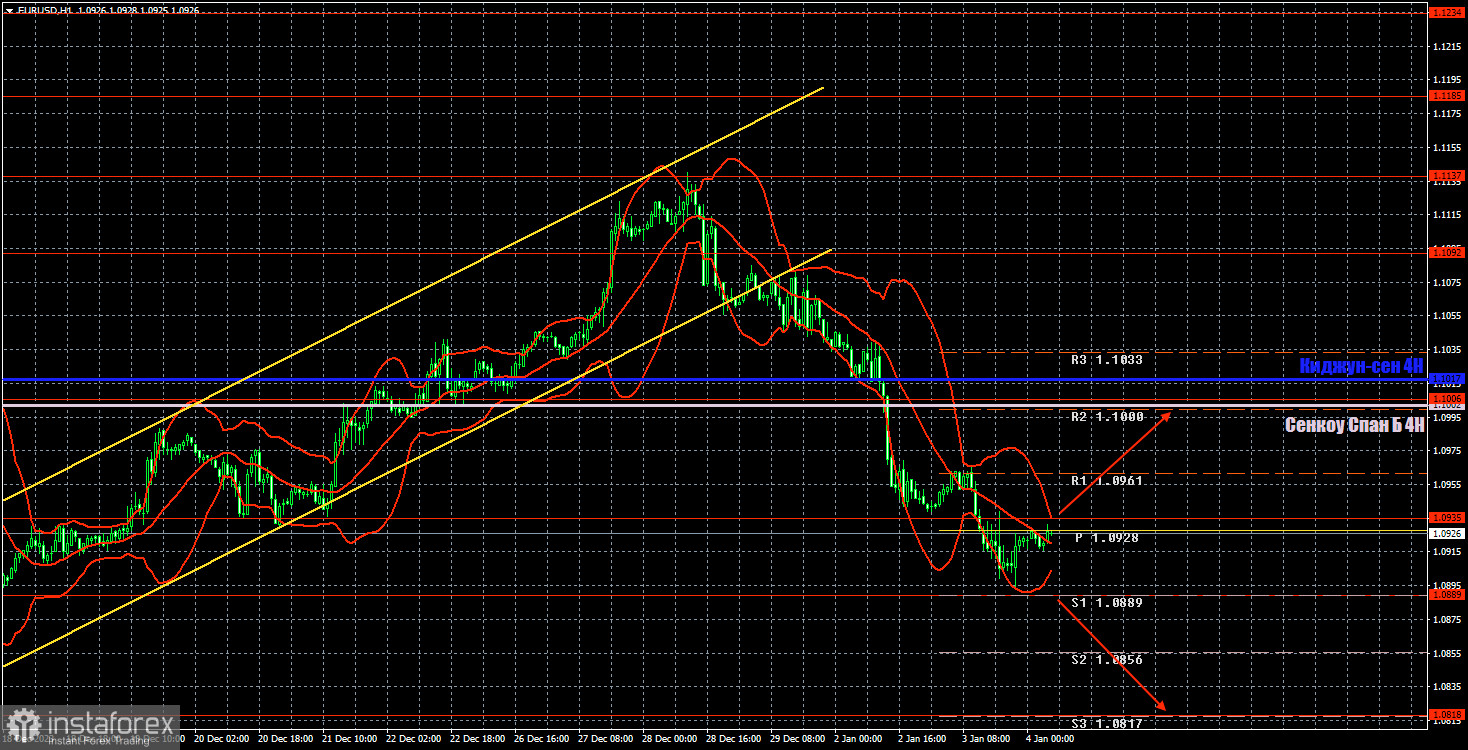
EUR/USD continued to trade lower on Wednesday after breaking out of the ascending channel. Therefore, from a technical perspective, everything is entirely logical and predictable. The euro had been rising for approximately three months, and this growth is still considered as a correction. Therefore, the current decline could be the start of a new downtrend on the hourly time frame and the continuation of the old one on the 24-hour time frame.
Yesterday, the pair almost dropped to the 9th level. Of course, there is always a risk of unexpected movements, and in the euro's case, we have seen several instances where it had no justifiable reasons to rise, and yet the single currency still appreciated. Therefore, we remind you that any fundamental expectations are just hypotheses. Prices are determined by the market itself, and technical analysis visualizes what is happening. Trading should be done in full accordance with the technique.
Yesterday, the US released its first batch of important reports of the year. The number of job openings (JOLTs) in November turned out to be slightly below forecasts, while the ISM Manufacturing Purchasing Managers' Index (PMI) slightly exceeded expectations. It seems that the market considered the ISM index slightly more important, so the dollar strengthened a bit. However, the market reaction was quite weak, and by the end of the day, the euro had offset some of its losses.
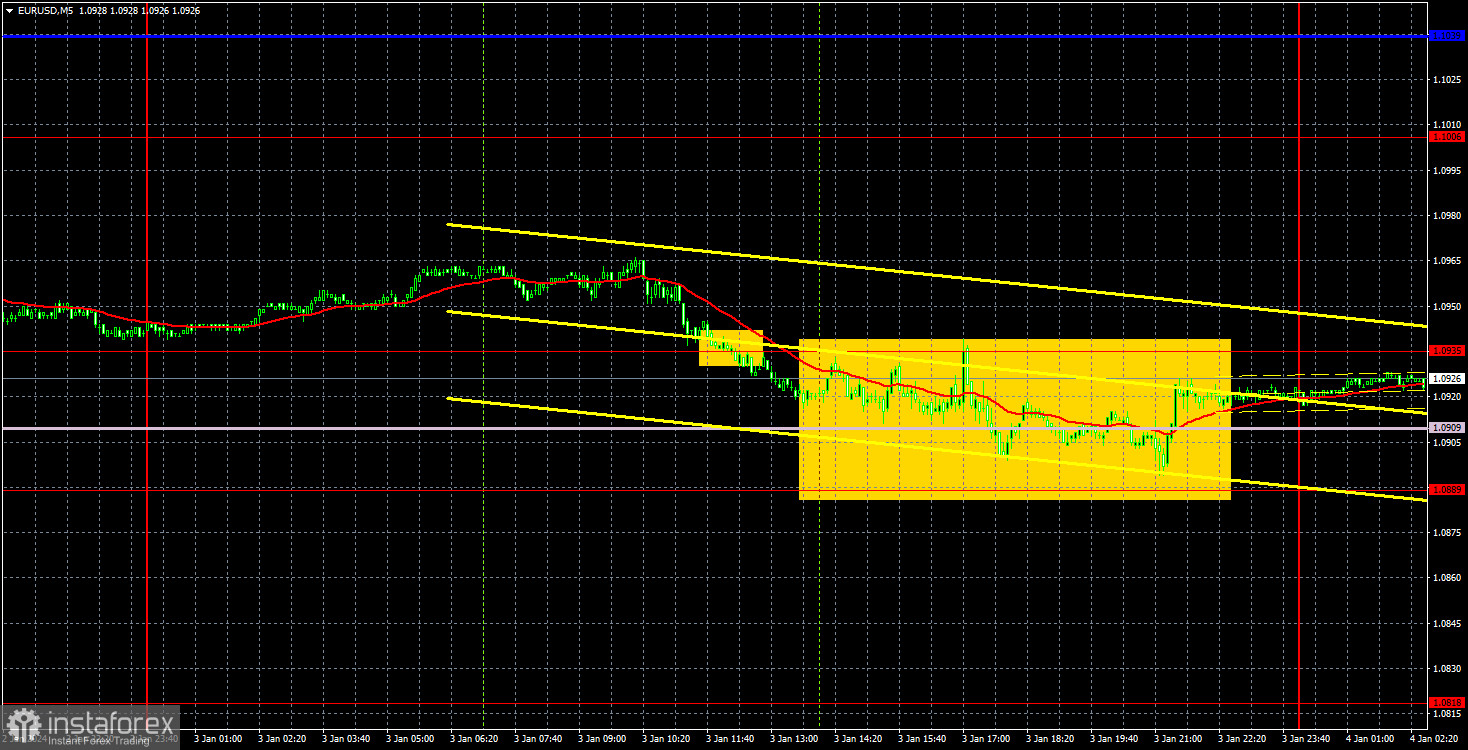
Speaking of trading signals, the first one formed when the price settled below the level of 1.0935. However, it immediately entered the range of 1.0889-1.0935, with the Senkou Span B line running through the middle of it. Since the lines and levels were very close to each other, we did not dare to open trades between them. The risk of a flat was too high.
COT report:

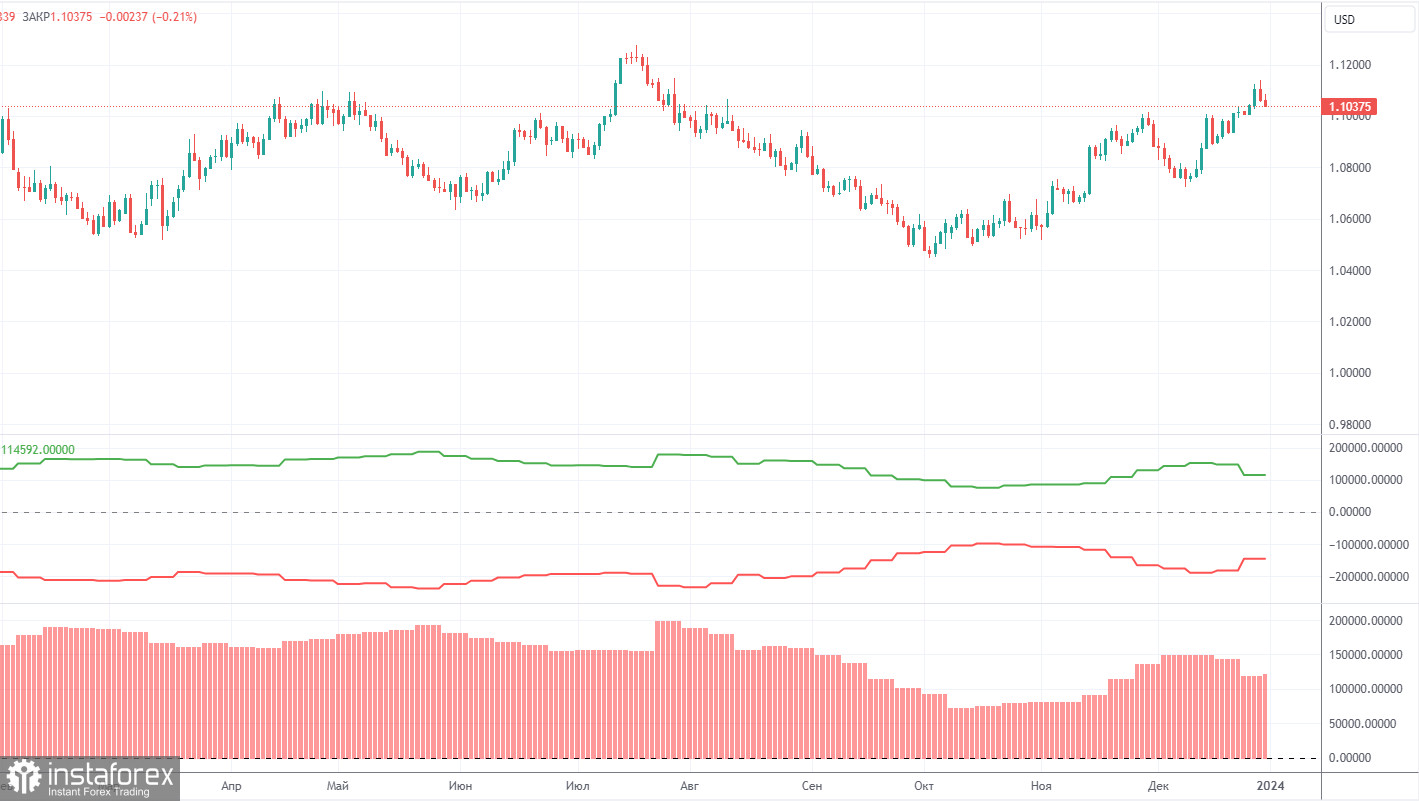
The latest COT report is dated December 26. In the first half of 2023, the net position of commercial traders hardly increased, but the euro remained relatively high during that period. Then, the euro and the net position both went down for several months, as we anticipated. However, in the last few weeks, both the euro and the net position have been rising. Therefore, we can conclude that the pair is correcting higher, but the corrections cannot last forever because they are just corrections.
We have previously noted that the red and green lines have moved significantly apart from each other, which often precedes the end of a trend. Currently, these lines are moving apart again. Therefore, we support the scenario where the euro should fall and the upward trend must end. During the last reporting week, the number of long positions for the non-commercial group increased by 3,100, while the number of short positions increased by 300. Consequently, the net position increased by 2,800. The number of buy contracts is still higher than the number of sell contracts among non-commercial traders by 118,000. The gap is significant, and even without COT reports, it is evident that the euro should continue to fall.
Analysis of EUR/USD 1H

On the 1-hour chart, EUR/USD has settled below the Kijun-sen line, Senkou Span B line, and the channel, which suggests the possibility of a new downtrend. At the moment, the pair is stuck between the levels of 1.0889 and 1.0935, and it may be prudent to wait for the price to exit this range. Since the pair has been falling for several consecutive days, an upward correction to the lines of the Ichimoku indicator is likely.
Today, we consider it reasonable to look for a small bullish rebound, but the pair is currently in a sideways channel, so we can consider opening trades once the quotes leave this area. In case of a consolidation above the level of 1.0935, we expect the price to rise towards the Senkou Span B line and the psychological level of 1.1002. In case of a consolidation below 1.0889, we can expect the price to fall towards 1.0818.
On January 4, we highlight the following levels for trading: 1.0658-1.0669, 1.0757, 1.0818, 1.0889, 1.0935, 1.1006, 1.1092, 1.1137, 1.1185, 1.1234, 1.1274, as well as the Senkou Span B line (1.1002) and Kijun-sen (1.1017). The Ichimoku indicator lines can shift during the day, so this should be taken into account when identifying trading signals. Don't forget to set a breakeven Stop Loss if the price has moved in the intended direction by 15 pips. This will protect you against potential losses if the signal turns out to be false.
On Thursday, among the somewhat important events, we can highlight the inflation report in Germany and the US ADP report on changes in employment. The market may ignore these data, but they are still more significant compared to other reports.
Description of the chart:
Support and resistance levels are thick red lines near which the trend may end. They do not provide trading signals;
The Kijun-sen and Senkou Span B lines are the lines of the Ichimoku indicator, plotted to the 1H timeframe from the 4H one. They provide trading signals;
Extreme levels are thin red lines from which the price bounced earlier. They provide trading signals;
Yellow lines are trend lines, trend channels, and any other technical patterns;
Indicator 1 on the COT charts is the net position size for each category of traders;
Indicator 2 on the COT charts is the net position size for the Non-commercial group.


