


Analyzing Thursday's trades:
GBP/USD on 30M chart
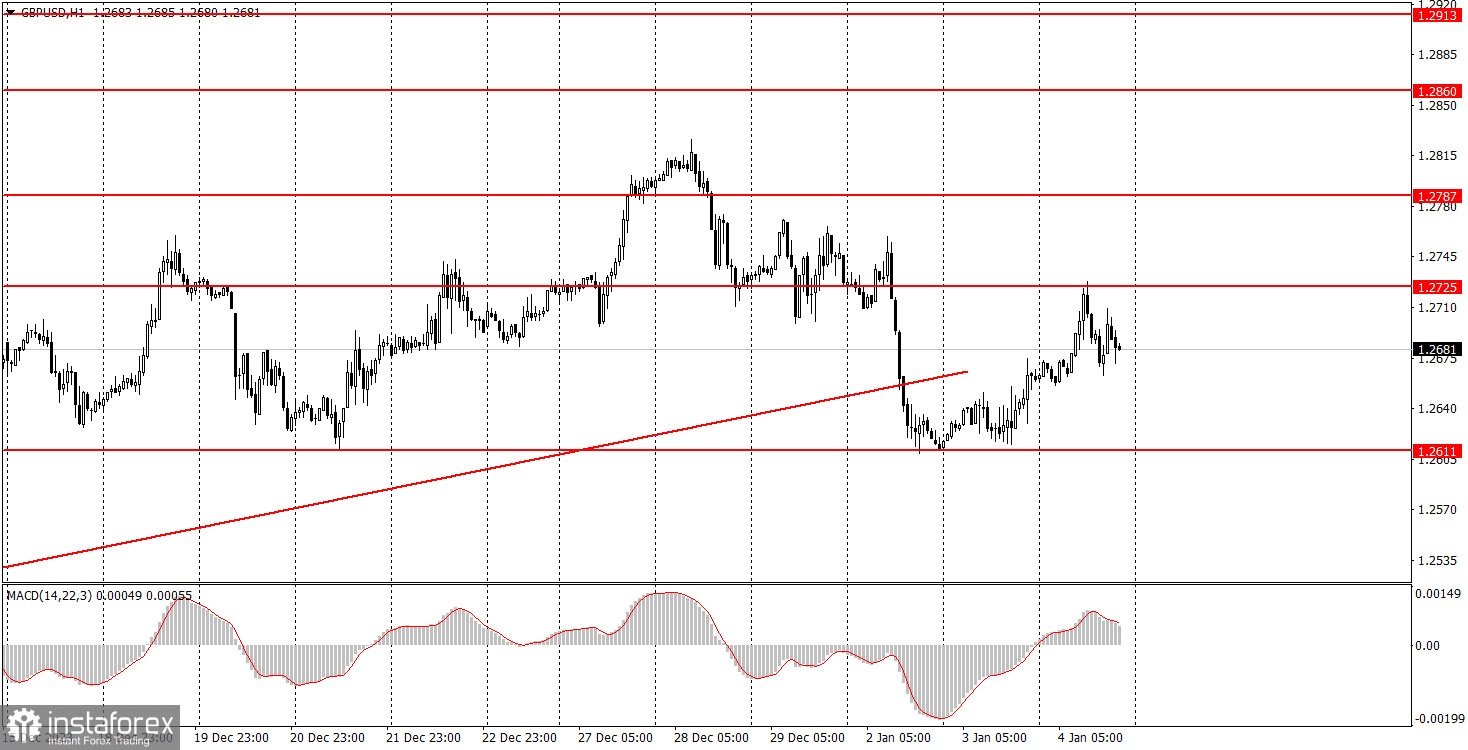
GBP/USD showed a fairly decent upward movement at the end of Thursday. This doesn't allow us to make bold conclusions, like bringing back the uptrend, but it's clear that the British pound could no longer fall further. For the second time, it rebounded from the level of 1.2611 and moved up significantly. Therefore, the current assessment is as follows: there are no signs of ending the downtrend, except for breaking the uptrend line. The pair has simply experienced a slight bearish correction, which was enough to break the trendline. However, the uptrend is not over; it is merely on pause.
The UK released the second estimate of its Services PMI for December. It turned out to be higher than the initial estimate, which supported the pound in the morning. In the second half of the day, reports on ADP employment, initial jobless claims, and Business Activity in the services sector for December were published in the United States. Each of these three reports exceeded forecasts to some extent. As a result, the dollar had the upper hand in the second half of the day. However, the rise was relatively modest, and on Friday, everything will depend on the US data.
GBP/USD on 5M chart
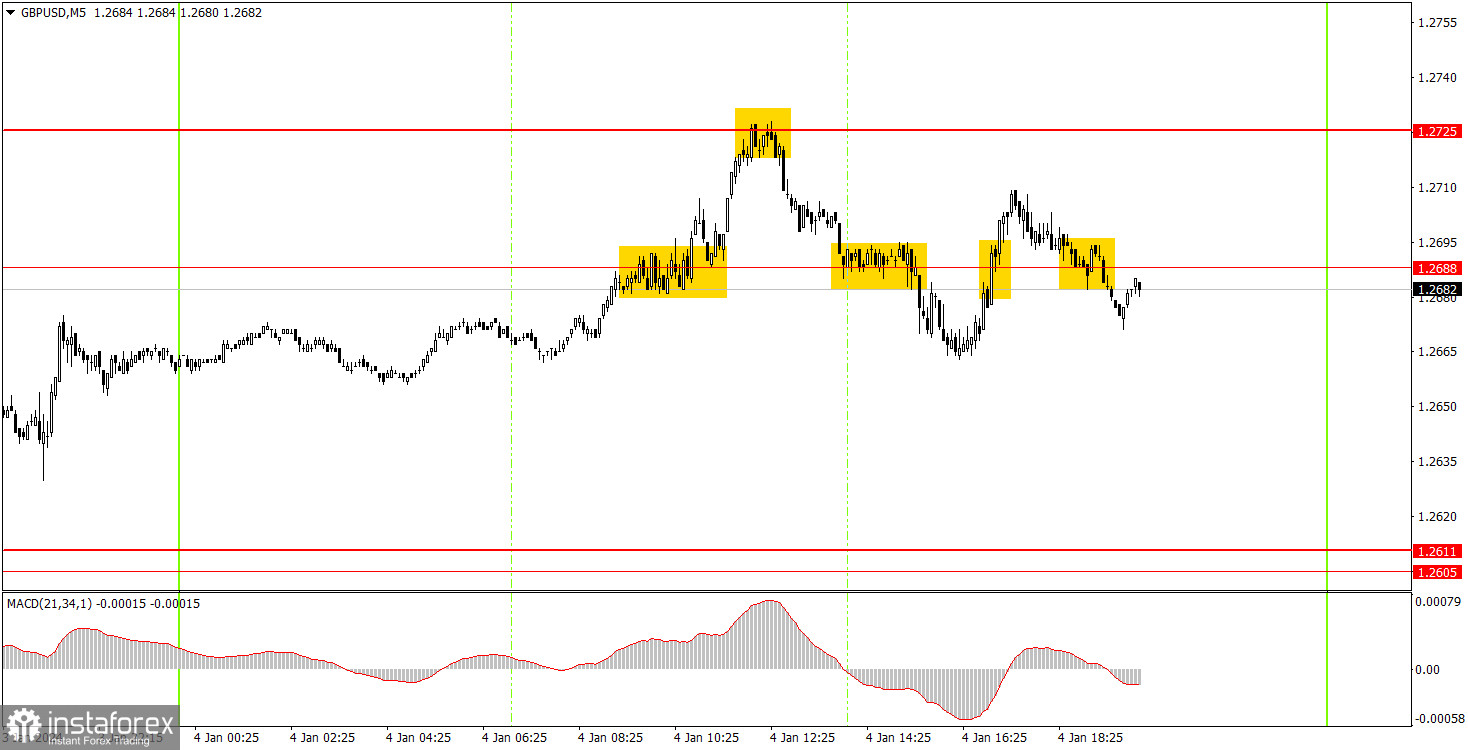
A relatively large number of signals were generated on the 5-minute chart. During the European trading session, the price perfectly broke above the level of 1.2688 and also rebounded perfectly from the level of 1.2725. A long position could have earned about 10-15 pips. A short position could have earned roughly the same amount, as it should have been closed during the US session when the price consolidated above the level of 1.2688. This consolidation served as a buy signal, but it turned out to be a false signal. Unfortunately, this trade resulted in a loss, which offset the profit from the first two trades. The price was changing direction too frequently.
Trading tips on Friday:
On the hourly chart, GBP/USD broke the trendline and now, for the first time in a long while, has a real chance of forming a new downtrend. However, traders failed to break through the level of 1.2611, so the downward movement was postponed once again.
The price may continue to fall after rebounding from the level of 1.2725. However, the direction of movement will largely depend on the US reports, where at least three important reports will be published. Therefore, the pound could either rise or fall on Friday.
The key levels on the 5M chart are 1.2270, 1.2310, 1.2372-1.2387, 1.2457, 1.2502, 1.2544, 1.2605-1.2611, 1.2688, 1.2725, 1.2787-1.2791, 1.2848-1.2860, 1.2913, 1.2981-1.2993. On Friday, the UK event calendar is empty, but in the US, reports on Nonfarm Payrolls, unemployment, and the ISM Business Activity in the services sector will be released. We might witness strong movements with frequent reversals in the second half of the day.
Basic trading rules:
1) Signal strength is determined by the time taken for its formation (either a bounce or level breach). A shorter formation time indicates a stronger signal.
2) If two or more trades around a certain level are initiated based on false signals, subsequent signals from that level should be disregarded.
3) In a flat market, any currency pair can produce multiple false signals or none at all. In any case, the flat trend is not the best condition for trading.
4) Trading activities are confined between the onset of the European session and mid-way through the U.S. session, after which all open trades should be manually closed.
5) On the 30-minute timeframe, trades based on MACD signals are only advisable amidst substantial volatility and an established trend, confirmed either by a trendline or trend channel.
6) If two levels lie closely together (ranging from 5 to 15 pips apart), they should be considered as a support or resistance zone.
How to read charts:
Support and Resistance price levels can serve as targets when buying or selling. You can place Take Profit levels near them.
Red lines represent channels or trend lines, depicting the current market trend and indicating the preferable trading direction.
The MACD(14,22,3) indicator, encompassing both the histogram and signal line, acts as an auxiliary tool and can also be used as a signal source.
Significant speeches and reports (always noted in the news calendar) can profoundly influence the price dynamics. Hence, trading during their release calls for heightened caution. It may be reasonable to exit the market to prevent abrupt price reversals against the prevailing trend.
Beginners should always remember that not every trade will yield profit. Establishing a clear strategy coupled with sound money management is the cornerstone of sustained trading success.


