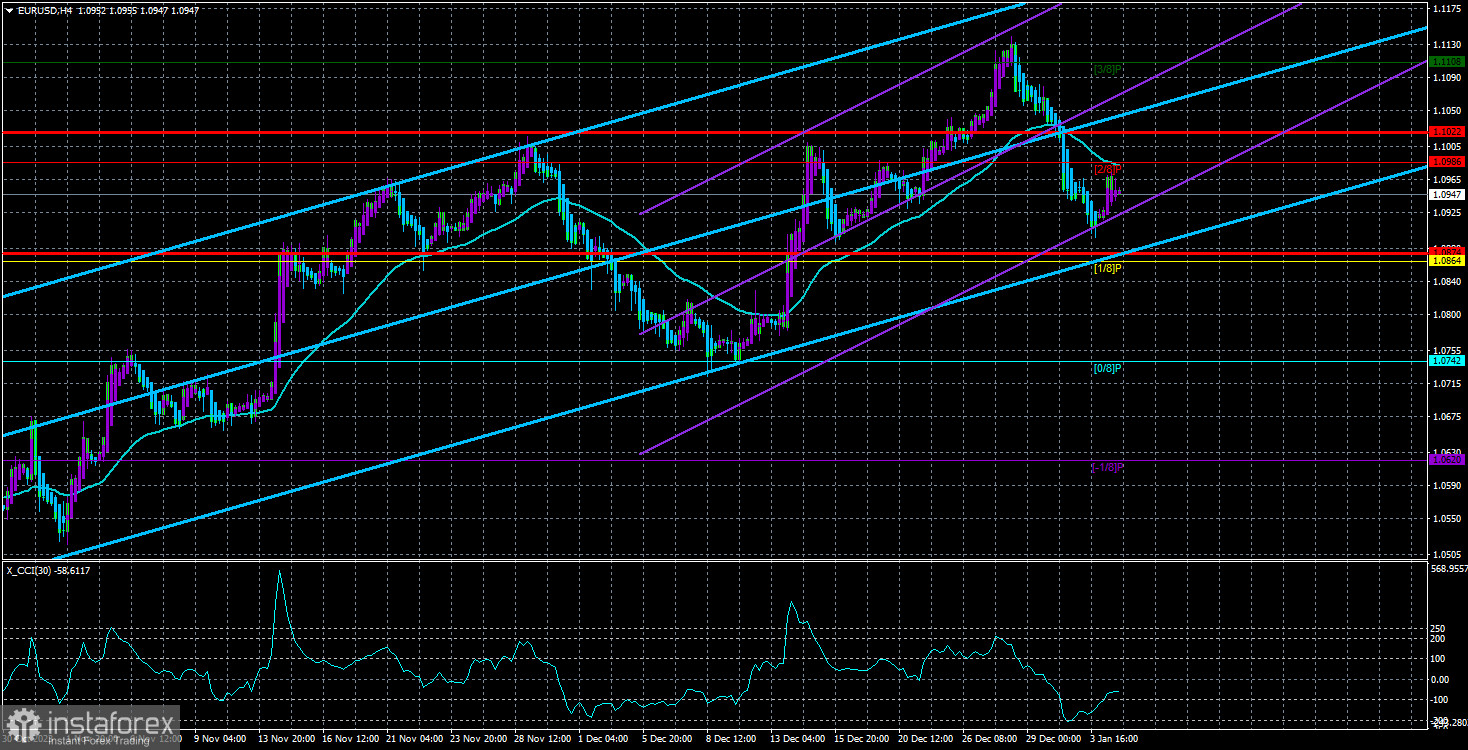
The currency pair EUR/USD has been correcting against the correction for the last 24 hours. The longer the European currency rises, the more complicated the technical picture becomes. It's worth noting that all the upward movement over the last three months is considered a correction. Therefore, any downward movement is a correction against the correction. And the small rebound we saw yesterday is a correction against the correction against the correction.
Understanding the current technical picture takes a lot of work. The pair has been rising for a long time, and the only reason experts point out for this movement is the "potential interest rate divergence between the ECB and the Fed." In other words, the ECB and the Fed have yet to start lowering interest rates, but the market has already begun to factor in this possibility. Moreover, it started doing so not yesterday but a couple of months ago, when we began to notice the illogical rise of the European currency. From time to time, the dollar did have reasons to fall, but who can say that the euro did not have similar reasons?
The EUR/USD pair's chart gives the impression that Europe is thriving while America is in complete chaos. The European currency is rising rapidly, even during the New Year week. The fact that the market has started to react to the potential interest rate divergence is not surprising, as traders usually try to anticipate future changes rather than wait for them to happen. However, even if this assumption is correct, the European currency has already appreciated enough for the interest rate divergence factor to be considered.
The current movement remains illogical. The market believes that the Fed will cut rates more aggressively in 2024 and do so faster than the ECB. Even though the Federal Reserve is already hinting at three rate cuts this year, the market somehow believes in 4-5 stages of monetary policy easing. In other words, the dollar is currently hostage to market expectations. The market does not believe in objective reality and operates in a parallel world, but currency quotes are influenced solely by the market. So, what the market believes in is very important.
On Wednesday evening, the minutes of the last Fed meeting were published. Nothing was interesting or scandalous in it, of course. The document once again signaled to traders that the policy easing would begin in 2024, and the "dot plot" indicated three possible rate cuts.
The minutes also reflected the sentiment of FOMC members, who are now concerned about keeping rates at their peak for too long, which could trigger a recession in the US economy. The Fed considers the battle against high inflation to have already been won. However, the Fed minutes did not answer when the regulator would start reducing rates.
All the information available at the moment is being interpreted in different ways. People need to find out how often the Fed will cut rates or when it will start the easing cycle. The same goes for the ECB. The market believes that there will be more rate cuts in the US and, based on this, continues to focus more on the European currency despite the bleak state of the EU economy.

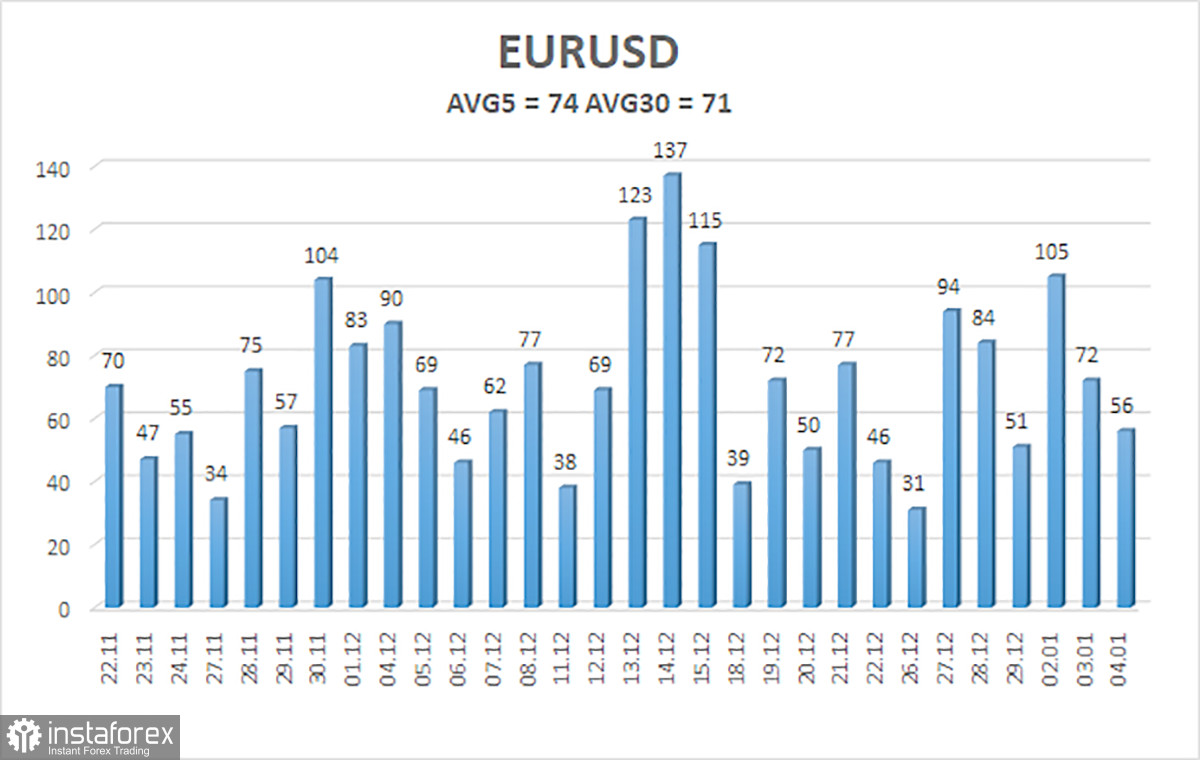
The average volatility of the EUR/USD currency pair over the last five trading days as of January 5th is 74 points and is characterized as "average." Therefore, we expect the pair to move between the levels of 1.0874 and 1.1022 on Friday. A downward reversal of the Heiken Ashi indicator suggests a possible resumption of the downward movement.
The nearest support levels:
S1 – 1.0864
S2 – 1.0742
S3 – 1.0620
The nearest resistance levels:
R1 – 1.0986
R2 – 1.1108
R3 – 1.1230
Trading recommendations:
The EUR/USD pair remains below the moving average line, so a downward movement may resume. The overbought condition of the CCI indicator has indicated excessively high euro values for a long time, and only now are we starting to see signals of a trend reversal downward. Therefore, it is advisable to look for short positions if the price bounces off the moving average, with targets at 1.0864 and 1.0742. After a price confirmation above the moving average, we will consider new long positions with a target of 1.1108.
Illustration explanations:
Linear regression channels - help determine the current trend. If both channels point in the same direction, the trend is strong.
The moving average line (settings 20,0, smoothed) - determines the short-term trend and the direction for trading.
Murray levels - target levels for movements and corrections.
Volatility levels (red lines) - the probable price channel where the pair will trade the next day based on current volatility indicators.
CCI indicator - entering the oversold area (below -250) or overbought area (above +250) indicates an impending trend reversal in the opposite direction.


