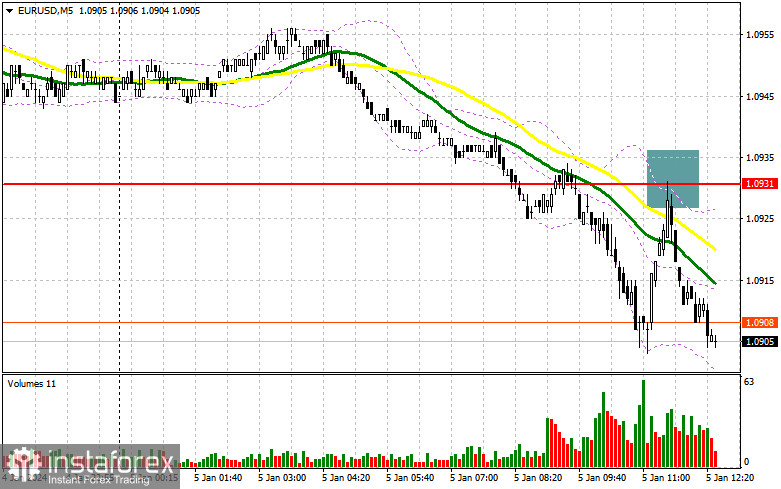
In my morning forecast, I highlighted the level of 1.0931 and planned to make trading decisions based on it. Let's look at the 5-minute chart and analyze what happened there. The rise and the formation of a false breakout around 1.0931 led to a good entry opportunity for selling the euro in continuation of the downtrend. As a result, the pair dropped by more than 25 points. The technical picture was slightly revised for the second half of the day.

To open long positions on EUR/USD, the following is required:
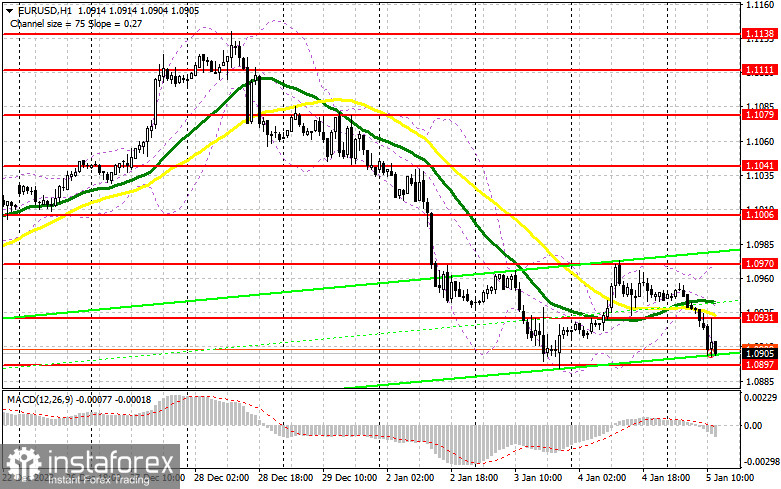
December data showed that inflation in the Eurozone increased, but not as significantly as many economists had feared, which maintained pressure on the European currency. Core prices matched the forecasts, also showing a decrease. If the labor market data in the second half of the day indicates the US economy's strength, the euro's decline will likely continue with even greater force. First and foremost, attention should be paid to the dynamics of employment in the non-agricultural sector of the US, as well as the ISM Services Business Activity Index. Maintaining strong job growth will increase pressure on EUR/USD. In this scenario, I will act only after a decline and the formation of a false breakout around 1.0897, the lower boundary of the new sideways channel. Only this will provide a suitable entry point into the market with expectations of a pair's recovery and the prospect of retesting 1.0931, where the moving averages are positioned, favoring sellers. A breakout and a new high-to-low range will allow opening long positions with a return to 1.0970, from where the euro fell so actively yesterday. The ultimate target will be 1.1006, where I will take profit. In the event of a further decline in EUR/USD and the absence of activity at 1.0897 on the second day, which will be possible only in the case of very strong US labor market data, we can expect a new and larger movement of the pair downwards. In this case, I plan to enter the market only after a false breakout is formed around 1.0867. I will open long positions from 1.0834 with the goal of an upward correction of 30-35 points within the day.
To open short positions on EUR/USD, the following is required:
Sellers have dealt with all the tasks, and now it's time to think about how to defend the new resistance at 1.0931, which still served as support in the morning. In the event of a rise after the US data, only the formation of a false breakout there, similar to what I discussed earlier, will indicate the presence of bears in the market, leading to a downward movement of the pair towards 1.0897. The breakout of this level will depend on US statistics, but only after a reverse test from bottom to top do I plan to receive another selling signal with an exit at 1.0867. The ultimate target will be a minimum of 1.0834, where I will take profit. In the event of an upward movement of EUR/USD in the second half of the day, a very weak US labor market report, and the absence of bears at 1.0931, buyers will return to the market. In this case, I will postpone sales until testing the next resistance at 1.0970. I will also sell there, but only after a failed breakout. I plan to open short positions immediately on a rebound from 1.1006 with the goal of a downward correction of 30-35 points.


Indicator signals:
Moving Averages:
Trading is conducted below the 30 and 50-day moving averages, indicating the likelihood of further euro depreciation.
Note: The author determines the period and prices of moving averages on the H1 hourly chart and differs from the general definition of classic daily moving averages on the D1 daily chart.
Bollinger Bands:
In case of a decline, the lower boundary of the indicator, around 1.0910, will act as support.
Indicator Descriptions:
- Moving Average (determines the current trend by smoothing volatility and noise). Period 50. Marked on the chart in yellow.
- Moving Average (determines the current trend by smoothing volatility and noise). Period 30. Marked on the chart in green.
- MACD Indicator (Moving Average Convergence/Divergence - convergence/divergence of moving averages). Fast EMA period 12. Slow EMA period 26. SMA period 9.
- Bollinger Bands. Period 20.
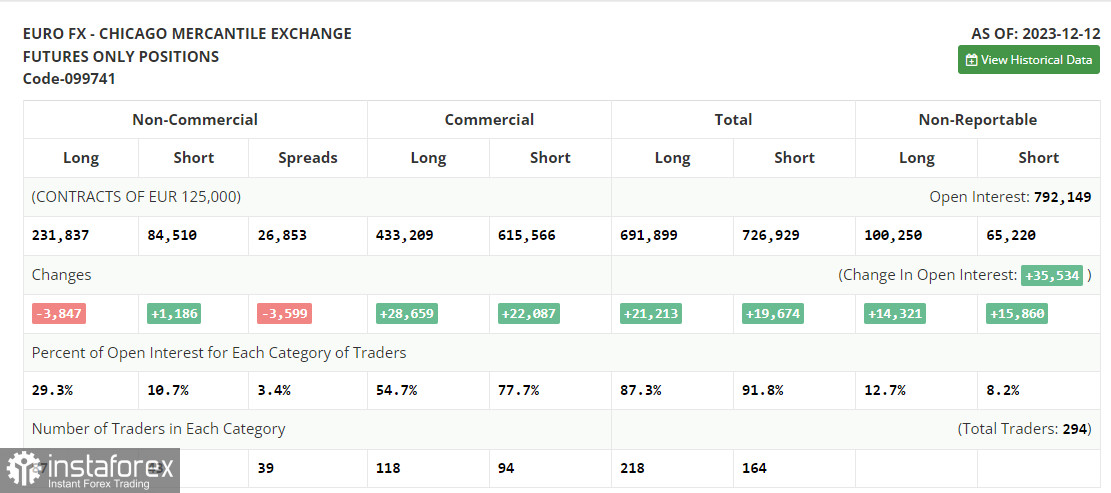
- Non-commercial traders - speculators, such as individual traders, hedge funds, and large institutions, use the futures market for speculative purposes and meet certain requirements.
- Long non-commercial positions represent the total long open positions of non-commercial traders.
- Short non-commercial positions represent the total short open positions of non-commercial traders.
- The total non-commercial net position is the difference between short and long non-commercial positions.


