Analysis of EUR/USD 5M

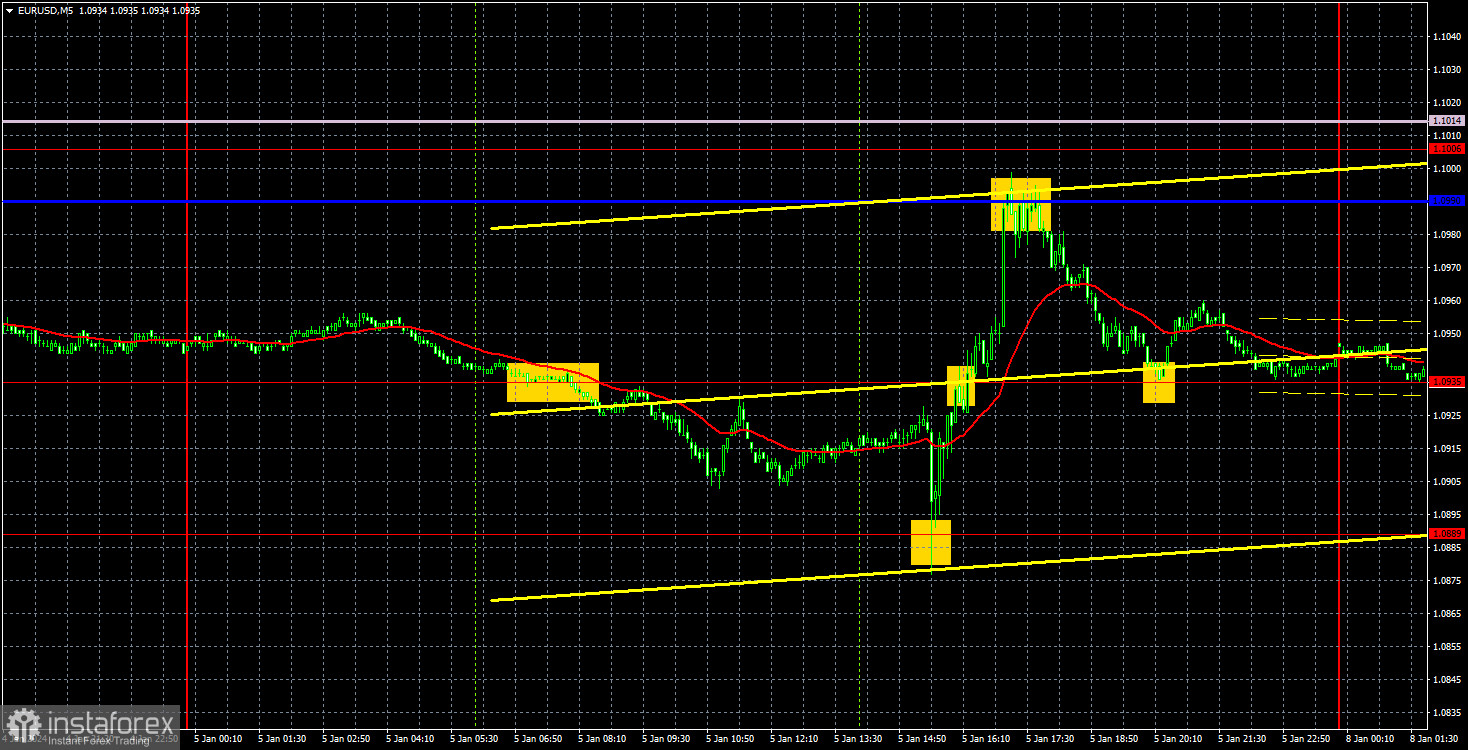
EURUSD traded with clear positivity on Friday. However, the bears were in charge at the beginning and end of the day, so overall, neither the euro nor the dollar were able to strengthen their positions. Nevertheless, once again, the euro traded positively when it was not expected to do so.
From a technical perspective, Friday's movements were quite predictable. The pair found itself in a limited price range and more or less remained within it. The price had been falling for the entire week, so a bullish correction was inevitable. Now we can hope that this story ended on Friday. Currently, the price is still below the key lines of the Ichimoku indicator, so it can still fall. The only problem is the level of 1.0889, from which the price has rebounded twice already.
From a macroeconomic perspective, the eurozone inflation report exerted pressure on the single currency, as the actual value turned out to be lower than the forecast. However, we can't say the same thing for the U.S. reports. Despite positive values for Non-Farm Payrolls and unemployment, the dollar significantly declined after their release, as traders for some reason considered the downward revision of values for October and November in the Non-Farm Payrolls report more important than the latest value for December. In general, the dollar missed the chance to strengthen even further.
The trading signals were quite good, with key levels and lines executed almost perfectly. During the European session, the price settled below the level of 1.0935, after which it tested the level of 1.0889. Traders could gain about 20 pips with a short position. Bounces from the level of 1.0889 made it possible for us to open long positions, and subsequently, the price reached the Kijun-sen, from which it also bounced perfectly. Another 65 pips of profit. Bounces from the critical line could also be used to enter trades, and by the end of the day, the price returned to 1.0935, making it possible to gain about 30 pips.
COT report:

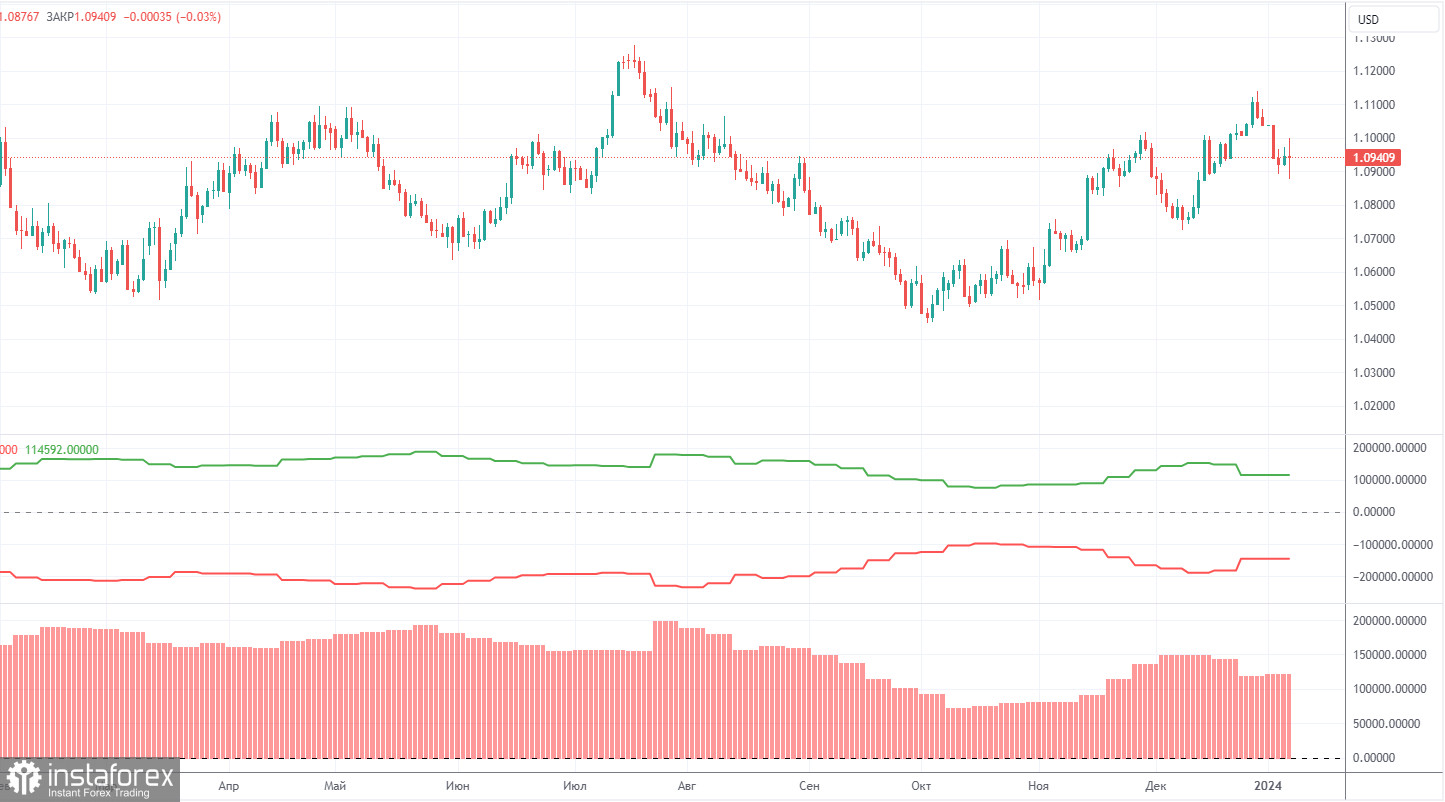
The latest COT report is dated January 2nd. In the first half of 2023, the net position of commercial traders hardly increased, but the euro remained relatively high during that period. Then, the euro and the net position both fell for several months, as we anticipated. However, in the last few weeks, both the euro and the net position have been rising. Therefore, we can conclude that the pair is correcting higher, but the corrections cannot last forever because they are just corrections.
We have previously pointed out that the red and green lines have moved significantly apart from each other, which often precedes the end of a trend. Currently, these lines are moving apart again. Therefore, we support the scenario where the euro should fall and the upward trend must end. During the last reporting week, the number of long positions for the non-commercial group increased by 700, while the number of short positions decreased by 1,300. Consequently, the net position increased by 2,000. The number of buy contracts is still higher than the number of sell contracts among non-commercial traders by 120,000. The gap is significant, and even without COT reports, it is clear that the euro should continue to fall.
Analysis of EUR/USD 1H

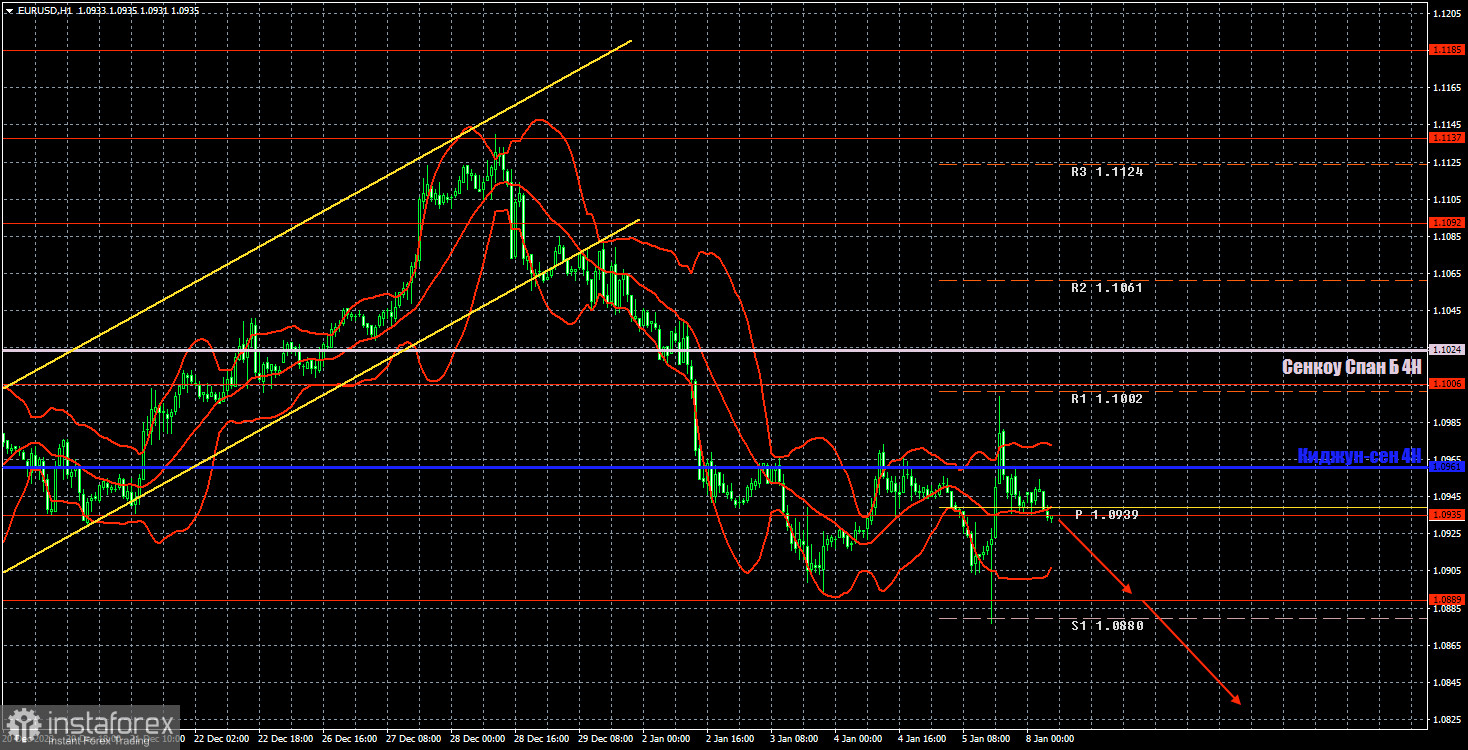
On the 1-hour chart, EUR/USD remains below the Kijun-sen line and the Senkou Span B line, so the downtrend persists. The level of 1.0889 is currently preventing the euro from falling further, but overall, we continue to advocate for a long and pronounced decline.
Today, we consider it reasonable to expect the pair to fall to the level of 1.0889. Since it's a Monday, volatility is likely to be low, so 45 pips is a significant distance for traders. Even if EUR/USD starts an upward movement, we will not consider it the start of a new uptrend.
On January 8, we highlight the following levels for trading: 1.0658-1.0669, 1.0757, 1.0818, 1.0889, 1.0935, 1.1006, 1.1092, 1.1137, 1.1185, 1.1234, 1.1274, as well as the Senkou Span B (1.1024) and Kijun-sen (1.0961) lines. The Ichimoku indicator lines can shift during the day, so this should be taken into account when identifying trading signals. Don't forget to set a breakeven Stop Loss if the price has moved in the intended direction by 15 pips. This will protect you against potential losses if the signal turns out to be false.
On Monday, we can only highlight the eurozone retail sales data. The U.S. economic calendar is empty. Therefore, we expect weak downward movements.
Description of the chart:
Support and resistance levels are thick red lines near which the trend may end. They do not provide trading signals;
The Kijun-sen and Senkou Span B lines are the lines of the Ichimoku indicator, plotted to the 1H timeframe from the 4H one. They provide trading signals;
Extreme levels are thin red lines from which the price bounced earlier. They provide trading signals;
Yellow lines are trend lines, trend channels, and any other technical patterns;
Indicator 1 on the COT charts is the net position size for each category of traders;
Indicator 2 on the COT charts is the net position size for the Non-commercial group.


