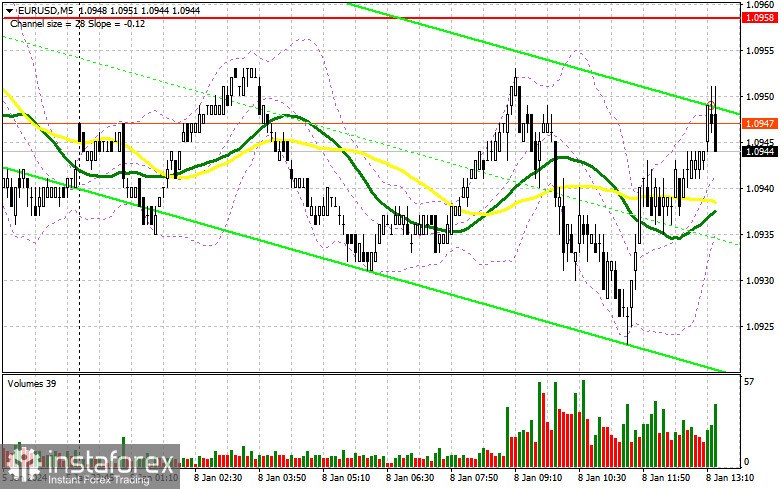
In my morning forecast, I pointed out the level of 1.0958 and planned to make trading decisions based on it. Let's look at the 5-minute chart and analyze what happened there. There was an upward movement, but we have yet to reach the test of this area due to low market volatility. The lack of suitable entry points in the first half also affected the technical picture, which I decided not to reconsider for the American session.

To open long positions on EUR/USD, it is required:
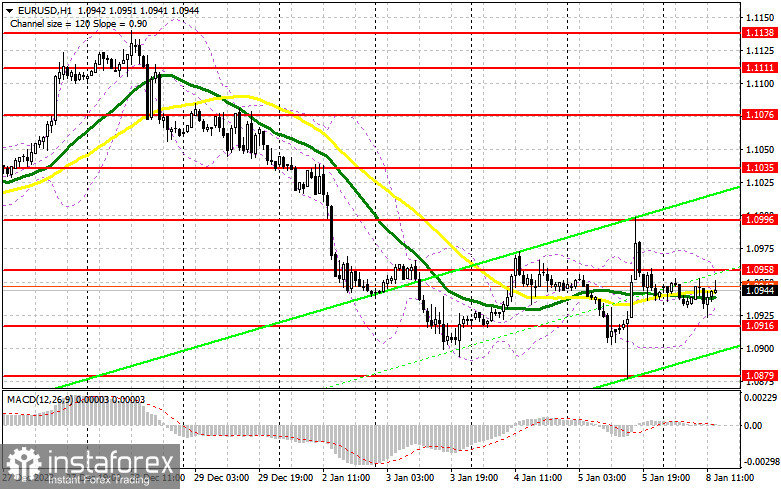
The released data for the Eurozone completely coincided with economists' forecasts. I warned that we would unlikely see significant market changes if this happened. Unfortunately, the balance of power remained the same during the American session. Therefore, all attention will be focused on the speech of FOMC member Raphael Bostic. His comments on the recent US labor market report could positively influence the direction of the dollar. In case of a decline in the pair, the most attractive scenario for me is still buying after the formation of a false breakout around 1.0916. This will provide a suitable entry point and upward movement towards 1.0958. Only a breakout and a subsequent move below this range will define the continuation of the bullish scenario, giving a chance to buy with a movement towards 1.0996. The ultimate target will be at 1.1035, where I will take profits. In the case of a decline in EUR/USD and no activity at 1.0916 in the second half of the day, the pressure on the pair will increase. In this case, I plan to enter the market only after forming a false breakout around last week's low of 1.0879. I will consider opening long positions from 1.0834 with the target of an upward correction of 30-35 points within the day.
To open short positions on EUR/USD, it is required:
Sellers are also in a waiting position, so it's better not to force short positions. Only a tough stance by a Federal Reserve representative will help protect the nearest resistance level of 1.0958. An unsuccessful consolidation will indicate the presence of sellers in the market, which will lead to a downward movement of the pair to the area of 1.0916. After breaking and consolidating below this range and a retest from the bottom up, I expect to receive another sell signal with an exit to 1.0879. The defense of this level will be the last hope for buyers. The ultimate target will be a minimum of 1.0834, where I will take profit. In case of an upward movement of EUR/USD in the second half of the day against the backdrop of soft comments by Federal Reserve representatives regarding future monetary policy, as well as the absence of bears at 1.0958, demand for EUR/USD will return, along with the chances of building an upward correction. In this case, I will postpone selling until the test of the next resistance level at 1.0996. I will also sell there, but only after an unsuccessful consolidation. I plan to open short positions immediately on the rebound from 1.1035 with the goal of a downward correction of 30-35 points.

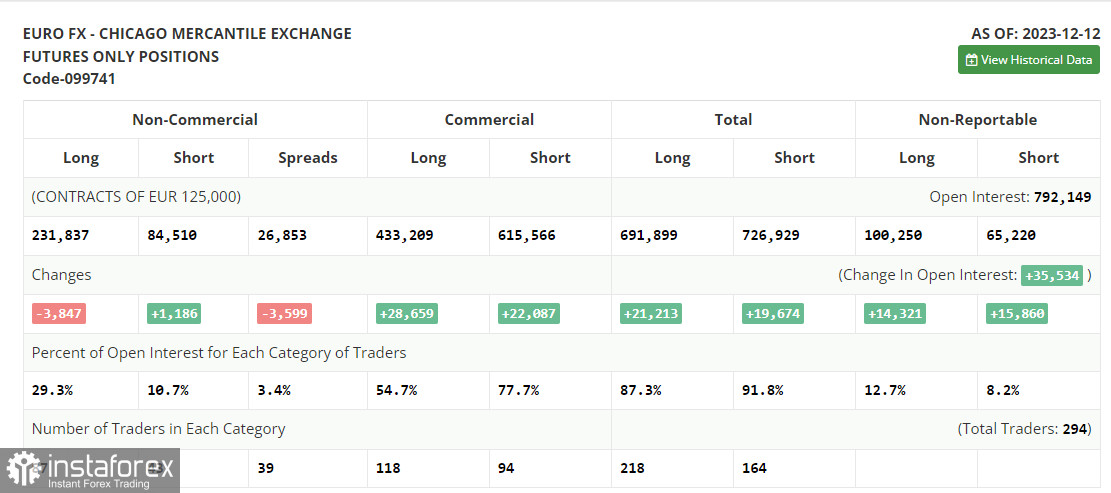
In the COT report (Commitment of Traders) as of December 12, there was a decrease in long positions and an increase in short positions. The December meeting of the US Federal Reserve and the shift towards a softer stance, along with the European Central Bank's tough position, had little effect on the positioning of large players, as the advantage of risk asset buyers is more than obvious. In the near future, a series of reports related to inflation in the Eurozone and the United States will be released, allowing for a clearer understanding of the Fed's position on interest rates next year. But no matter what the data shows, expectations for further strengthening the European currency in the medium term will continue to grow. The COT report shows that non-commercial long positions decreased by only 3,847 to 231,837, while short non-commercial positions increased by 1,186 to 84,510. As a result, the spread between long and short positions decreased by 3,599.

Indicator signals:
Moving Averages
Trading is carried out around the 30 and 50-day moving averages, indicating a sideways market.
Note: The author determines the period and prices of moving averages on the H1 hourly chart and differs from the general definition of classical daily moving averages on the D1 daily chart.
Bollinger Bands
In case of a decline, the lower boundary of the indicator at 1.0935 will act as support.
Indicator Descriptions:
- Moving Average (MA) determines the current trend by smoothing volatility and noise. Period - 50. Highlighted in yellow on the chart;
- Moving Average (MA) determines the current trend by smoothing volatility and noise. Period - 30. Highlighted in green on the chart;
- MACD (Moving Average Convergence/Divergence) indicator. Fast EMA - period 12. Slow EMA - period 26. SMA - period 9;
- Bollinger Bands. Period 20;
- Non-commercial traders are speculators, such as individual traders, hedge funds, and large institutions, using the futures market for speculative purposes and meeting specific requirements;
- Long non-commercial positions represent the total long open positions of non-commercial traders;
- Short non-commercial positions represent the total short open positions of non-commercial traders;
- The total non-commercial net position is the difference between non-commercial traders' short and long positions.


