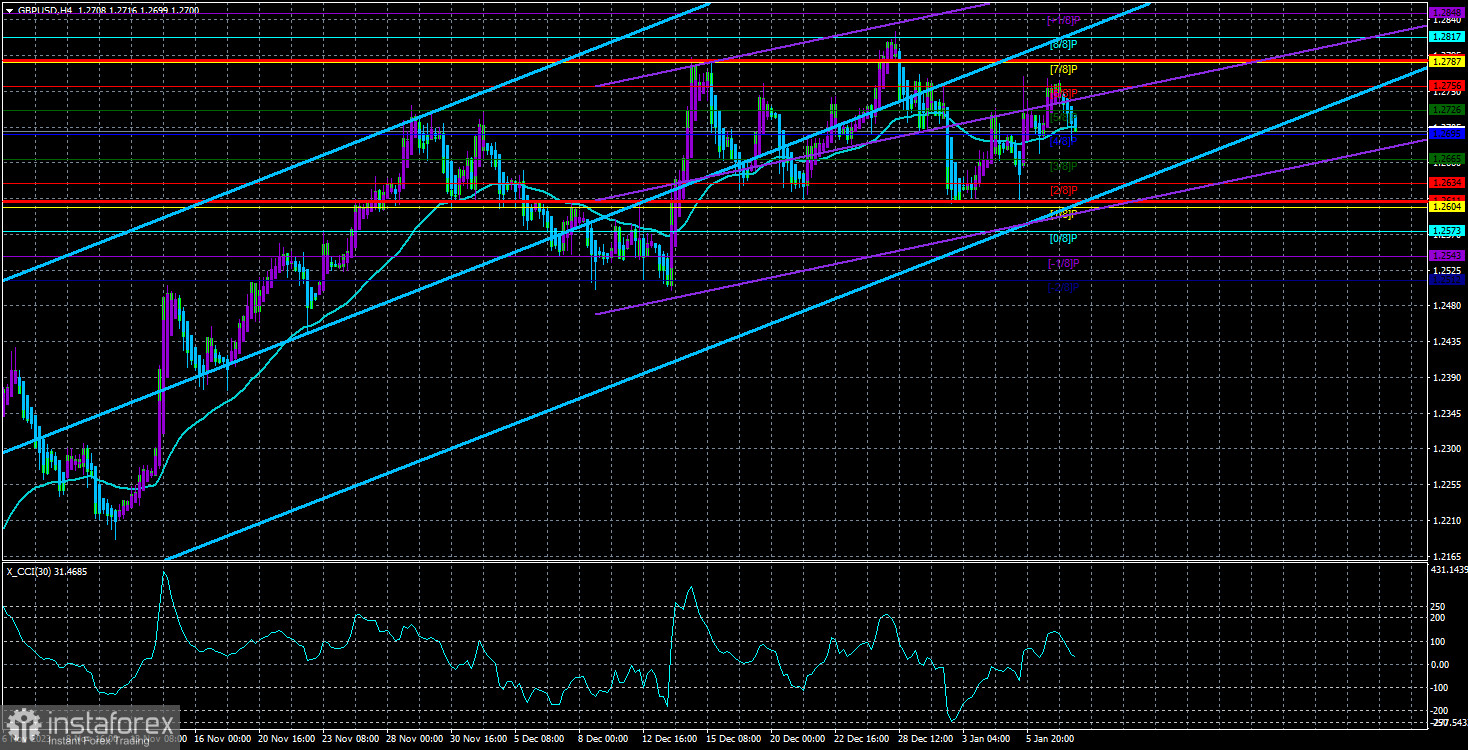
The GBP/USD currency pair continued to trade relatively calmly on Tuesday. It has been in a sideways channel for three weeks, with levels at 1.2620 and 1.2787 serving as boundaries. Therefore, any movements within this range may not directly connect to the fundamental and macroeconomic backdrop. The pair is flat, so any news, reports, and events only affect it to the extent they do.
There have been no news, reports, or events this week. On Monday and Tuesday, several Fed representatives gave speeches, which still needed to answer when the central bank would start lowering the key interest rate. The question is the answer to which the market has already provided for itself. We have repeatedly mentioned that the market has decided that the Fed will commence the easing process in March. Despite the recent labor market reports, which once again showed the strength of the U.S. economy, and the upcoming inflation report, which could show a new acceleration in the indicator, the likelihood of a Fed rate cut in March remains high, above 60%.
A few weeks ago, it reached 80%. Naturally, let's assume that most market participants anticipate and have confidence in the U.S. monetary policy easing within a mere two months. In that case, it's difficult for the dollar to show significant growth. Returning to Fed representatives' speeches, none even hinted at a possible rate cut. Moreover, Raphael Bostic noted that inflation may continue to slow down at the current rate and that this level should be maintained.
His colleague Michelle Bowman stated that the rate should remain at its current "for some time." It's doubtful that Ms. Bowman meant two months by "some time." Bowman also stated that the Fed would have to lower the rate "if inflation approaches 2%." Again, "if inflation approaches 2%!" This means we are not discussing a planned first-rate cut in March. The Federal Reserve will be ready to begin easing only when it is confident that inflation is declining according to its expectations.
Since inflation in the U.S. for December could reach 3.2-3.2% y/y, it is too early to expect the first easing in March. By logical reasoning, the market should also begin to understand this, and the new acceleration in U.S. inflation should further reduce the probability of a rate cut in March from the current 60% (according to the FedWatch tool). However, this does not mean that the British pound will start depreciating and the dollar will appreciate. The market has shown us for several months now that it doesn't care about fundamentals or macroeconomics.
All strong data from the U.S. has been ignored or has caused minimal dollar growth. All weak data from the U.S. has been priced in threefold. No one pays attention to the statements of Fed representatives, who practically say, "No one is planning to lower rates in March; it all depends on inflation." Thus, the dollar has to rely solely on technical factors. For the GBP/USD pair, a "head and shoulders" pattern is forming. If this is the case, then its "right shoulder" has completed near the level of 1.2756. In this case, it would be reasonable to expect a decline in quotes, but given the current bullish market sentiment, it is very difficult to predict how strong it will be.
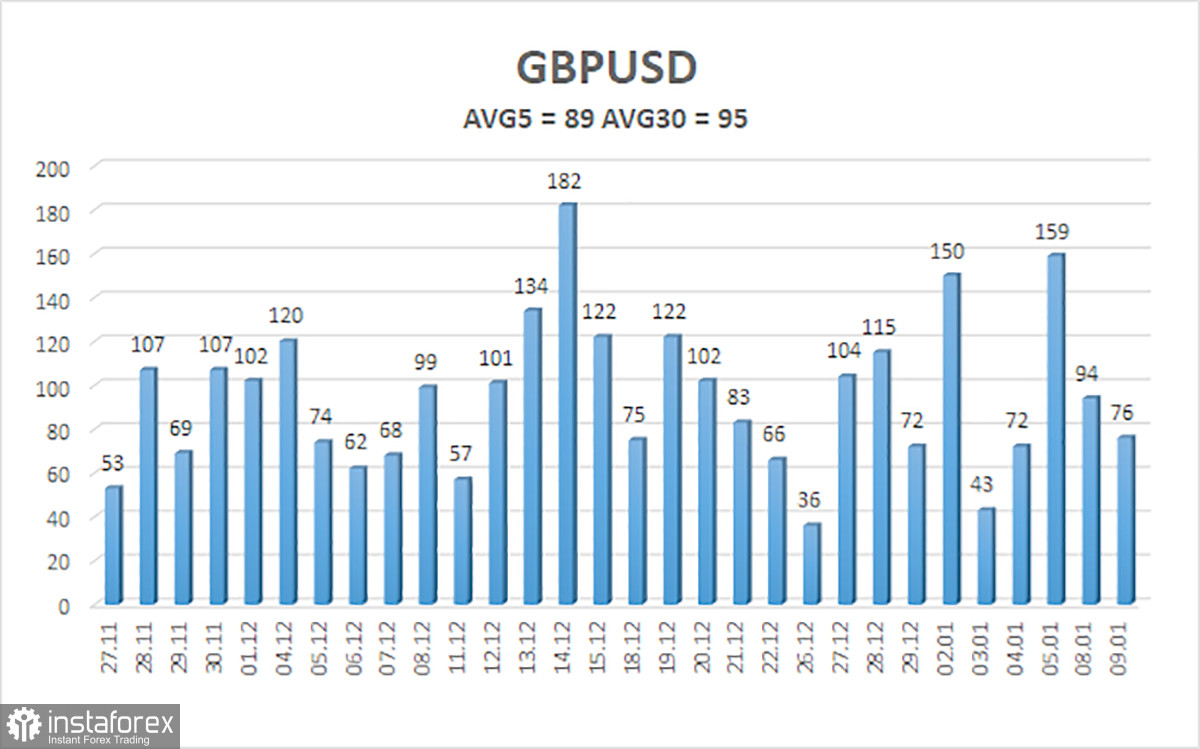
The average volatility of the GBP/USD pair over the last five trading days as of January 10th is 89 pips. For the GBP/USD pair, this value is considered "average." Therefore, on Wednesday, January 10th, we expect movement between 1.2611 and 1.2789. An upward reversal of the Heiken Ashi indicator will indicate a new attempt to resume the upward trend.
Nearest support levels:
S1 - 1.2695
S2 - 1.2665
S3 - 1.2634
Nearest resistance levels:
R1 - 1.2726
R2 - 1.2756
R3 - 1.2787
Explanations for the illustrations:
Linear regression channels - help determine the current trend. If both point in the same direction, the trend is strong right now.
The moving average line (settings 20.0, smoothed) - determines the short-term trend and the direction in which trading should be conducted.
Murray levels - target levels for movements and corrections.
Volatility levels (red lines) - the probable price channel in which the pair will move the next day, based on current volatility indicators.
CCI indicator - its entry into the oversold area (below -250) or overbought area (above +250) indicates an approaching trend reversal in the opposite direction.


