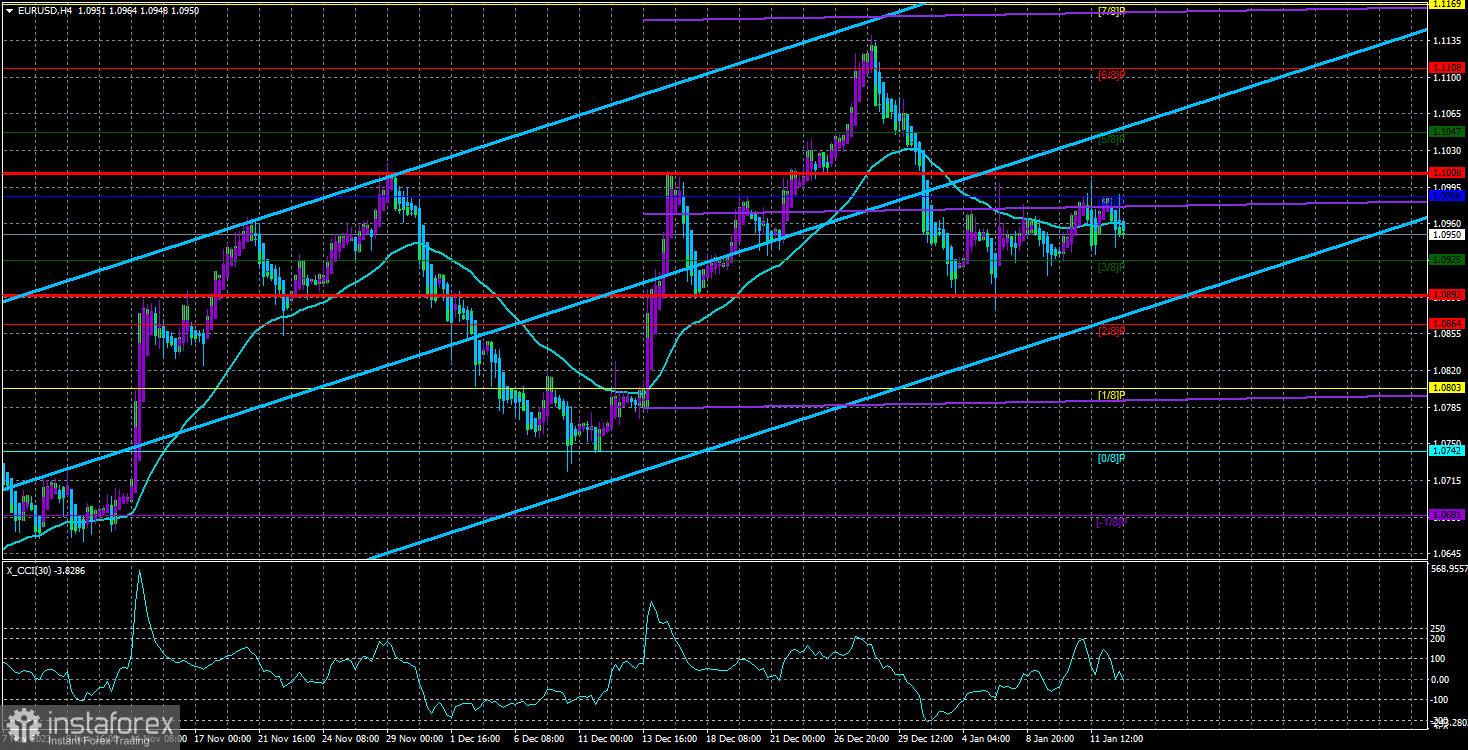
The currency pair EUR/USD continues to hover around the moving average line, and this situation can be quite confusing for novice traders and experienced ones. For over a week, we have observed sluggish growth in the European currency, and what it signifies needs to be clarified. If the market intended to resume the three-month uptrend, it would probably have switched to buying much sooner. As we have mentioned several times, if this is a correction, we should expect a new significant drop in the European currency.
In principle, the fundamental aspects characterizing the state of the EUR/USD pair have remained the same over time. The market ignores practically all factors favoring the American currency, so macroeconomic and fundamental factors hold little significance. Does it matter how strong the macroeconomic statistics are in the USA or what the representatives of the Federal Reserve say? Last week, Loretta Mester openly stated that the Fed is not ready to vote for an easing of monetary policy. In other words, even the monetary committee members are telling the market outright: there will be no rate cut in March. However, according to the FedWatch tool, the market's expectations suggest an almost 80% probability of a rate cut at the second meeting in 2024.
Either the market thinks the regulator is trying to confuse it or wants to avoid reacting to obvious facts. This makes it more challenging for us. What is happening with the current currency pair cannot be called logical and well-founded movements. Thus, the forecasting process is becoming significantly more complicated.
The market could resume an upward movement, which can be identified by surpassing the Murray level of 1.0986. However, we still anticipate movement only to the downside.
What interesting events are expected in the European Union for the coming week? There will be a few significant events. We can mention Christine Lagarde's speech and the inflation report. But again, what difference does it make to what Christine Lagarde says to the market? She is unlikely to announce that the ECB is again ready to raise rates. She will unlikely reveal that monetary policy easing will begin in the spring of 2024. And everything else the market already knows without another ECB head's speech. It's worth reminding that members of the European regulator's monetary committee speak practically daily, and their rhetoric hardly changes.
It all boils down to the same thing – rates will start to decrease this year, but probably not before the summer. The market currently has a high demand for the euro solely based on the assumption that the ECB will cut rates after the Fed and do so more slowly.
The inflation report in the EU also holds little significance for the market. According to forecasts, inflation will rise to 2.9% in December. A familiar figure? It is quite familiar, as it will be the second assessment for December. Second assessments rarely interest the market, as they rarely differ from the initial ones. The inflation report in Germany – has the same conclusions; the assessment will be the second one. What else? Industrial production and the ZEW Institute's index? The reports, considered secondary even in normal times, have no significance for the market now. There might be a local reaction within one day, but these events will not affect the overall market sentiment, which is currently expressed only through buying the pair.

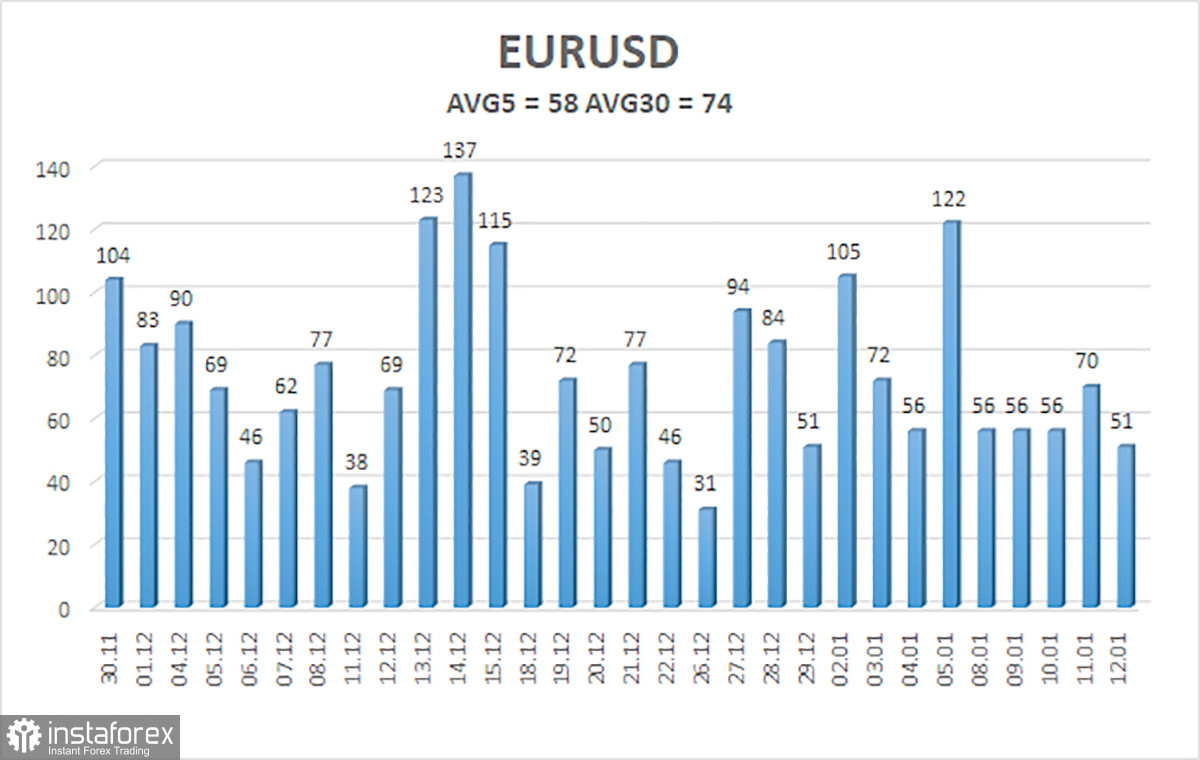
The average volatility of the EUR/USD currency pair over the past five trading days as of January 14 is 58 points and is characterized as "average." Therefore, we expect movement between the levels of 1.0892 and 1.1008 on Monday. A reversal of the Heiken Ashi indicator back down will indicate a new attempt to continue the new downtrend.
Nearest support levels:
S1 – 1.0925
S2 – 1.0864
S3 – 1.0803
Nearest resistance levels:
R1 – 1.0986
R2 – 1.1047
R3 – 1.1108
Explanations for the illustrations:
Linear regression channels – help determine the current trend. If both point in the same direction, the trend is currently strong.
The moving average line (settings 20.0, smoothed) – determines the short-term trend and the direction in which trading should be conducted.
Murray levels – target levels for movements and corrections.
Volatility levels (red lines) – the probable price channel the pair will trade in the coming day, based on current volatility indicators.
CCI indicator – its entry into the overbought area (above +250) or oversold area (below -250) indicates an impending trend reversal in the opposite direction.


