Analysis of EUR/USD 5M:

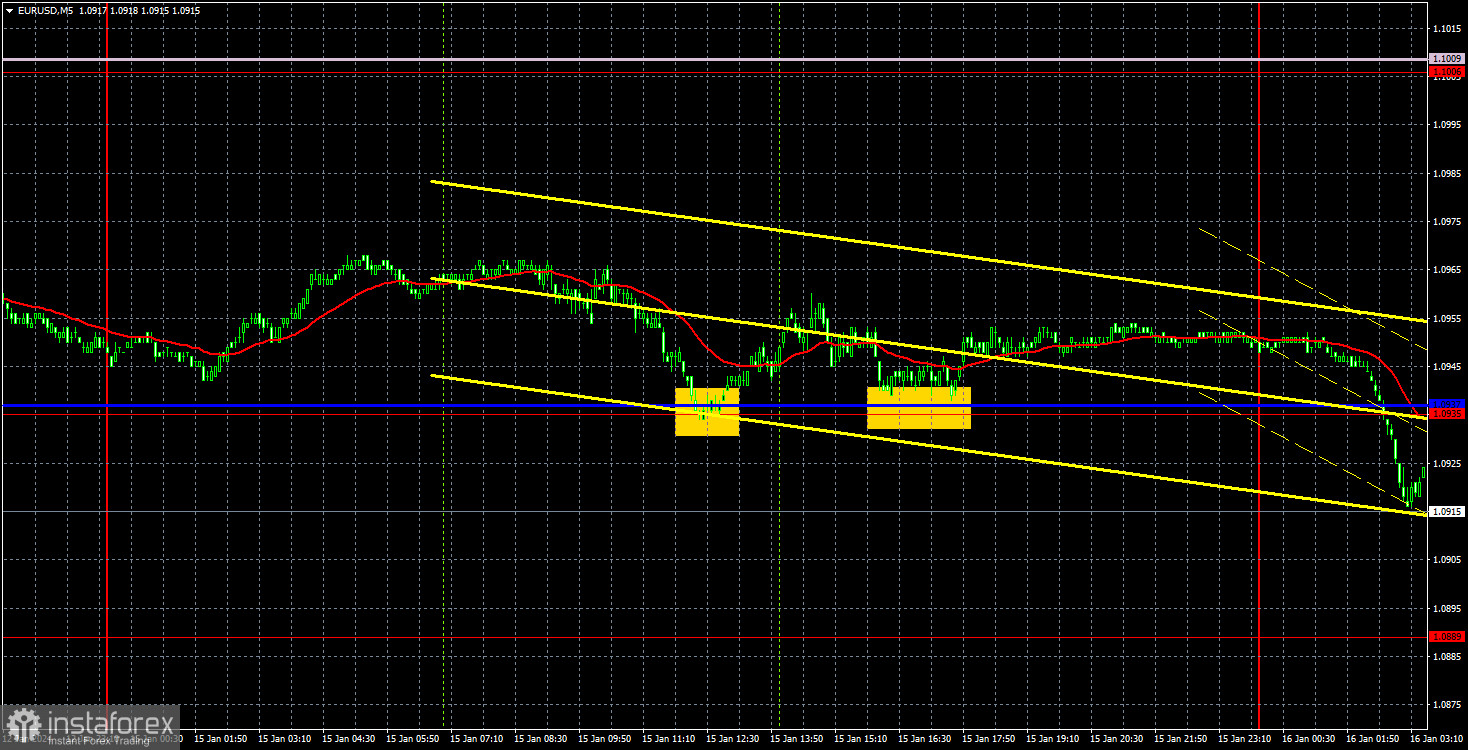
The EUR/USD currency pair continued its sluggish movement with a downward slope during the week's first trading day. We have repeatedly mentioned recently that the euro should continue to fall almost regardless of the circumstances, but a clear flat trend characterized the previous week. This week, we will finally see a trending movement, and it would be highly desirable for it to be downward, in line with the fundamentals and macroeconomic background.
On Monday, only one report was released in the European Union, which had virtually no impact on traders' sentiment. Industrial production in the EU contracted by 0.3% in November, which market participants were prepared for. Therefore, although the European currency was inclined to decline during the day, it remained above the critical line. The overall daily volatility did not even exceed 40 pips, so there was virtually no movement in reality.
The euro quotes sharply declined during the night, dropping below the Kijun-sen line. However, even this movement can be considered weak. The fact that the price is now below the critical line allows us to expect the long-awaited decline of the euro, but considering the market's reluctance to sell the euro, the decline may be short-lived.
We have already mentioned that the market has overly high expectations regarding the Fed's interest rate cut. If the Fed decides not to cut rates, the dollar will strengthen. As for trading signals, two were formed on Monday, but there was no particular point in trading them. The price bounced twice off the Kijun-sen line, which was around the 1.0935 level, but in both cases, it failed to move up even 20 points.
No sell signals were formed during the day, so traders could only open one buy trade (the signals duplicated each other), which brought about ten points of profit as it needed to be manually closed.
COT Report:
The latest COT report is dated January 9th. In the first half of 2023, commercial traders' net position hardly increased, but the euro remained relatively high during that time. Then, there was a drop in the euro and a decrease in the net position, which we expected. However, in the last few weeks, the euro and the net position have risen. Therefore, we draw a clear conclusion: the pair is correcting upwards, but corrections cannot last forever because they are just corrections.
We have already pointed out to traders that the red and green lines have significantly diverged, which often precedes the end of a trend. Currently, these lines are once again moving away from each other. Therefore, we still advocate for the decline of the European currency and the completion of the upward movement. During the last reporting week, the number of longs by the "Non-commercial" group increased by 0.7 thousand, while the number of shorts decreased by 1.3 thousand. Consequently, the net position increased by 2.0 thousand. The number of buy contracts is higher than that of sell contracts, which is 120 thousand among non-commercial traders. The gap is significant, and even without COT reports, it is evident that the European currency should continue to decline.
Analysis of EUR/USD 1H:
The pair remains below the Senkou Span B line on the hourly timeframe, so the overall downward trend is maintained. The level at 1.0889 did not allow the euro to go lower, but we continue to advocate for a long and strong decline of the European currency. For now, the price is in a flat range, and at the moment, there is no sign of its completion.
Today, we consider it reasonable to look at small sales with a target of 1.0889. Yesterday, the pair failed to return to the Senkou Span B line, so now there is a possibility of a drop back to where the last upward correction began. However, all current movements are flat, so the movements can be random.
On January 16th, we highlight the following levels for trading: 1.0658-1.0669, 1.0757, 1.0818, 1.0889, 1.0935, 1.1006, 1.1092, 1.1137, 1.1185, 1.1234, 1.1274, as well as the Senkou Span B (1.1008) and Kijun-sen (1.0956) lines. The Ichimoku indicator lines may move during the day, so this should be considered when determining trading signals. Remember to place a Stop Loss order at break-even if the price moves in the right direction by 15 pips. This will protect against potential losses if the signal turns out to be false.
Explanations for the illustrations:
Price support and resistance levels (resistance/support) - thick red lines around which movement may end. They are not sources of trading signals.
Kijun-sen and Senkou Span B lines - lines of the Ichimoku indicator transferred to the hourly timeframe from the 4-hour one. They are strong lines.
Extreme levels - thin red lines from which the price previously bounced. They are sources of trading signals.
Yellow lines - trendlines, trend channels, and any other technical patterns.
Indicator 1 on COT charts - the size of the net position of each category of traders.
Indicator 2 on COT charts - the size of the net position for the "Non-commercial" group.


