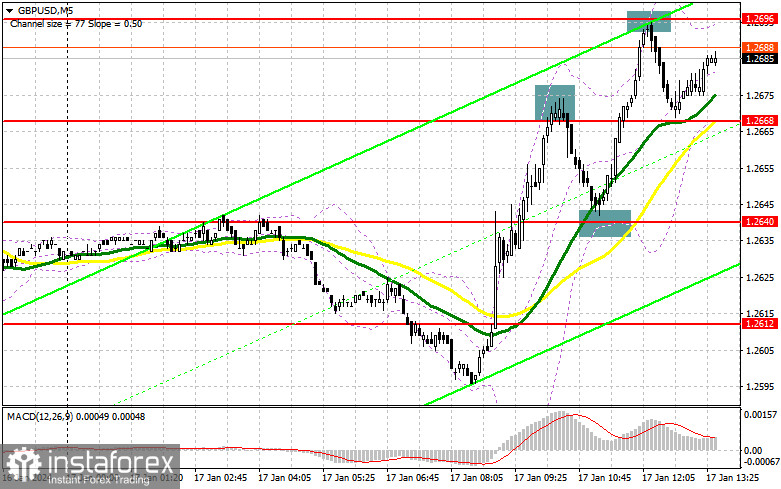
In my morning forecast, I drew attention to the level of 1.264 and planned to make entry decisions based on it. Let's look at the 5-minute chart and analyze what happened there. A decline and a false breakout formation around 1.2640 occurred, resulting in the pair rising by more than 50 points. The failure to sustain consolidation above 1.2668 following the release of US inflation data resulted in a notable downward correction against the developing bullish trend, leading to a 24-point drop in the pound. A similar scenario happened with the level of 1.2696. The technical picture was revised for the second half of the day.

To open long positions on GBP/USD, the following is required:
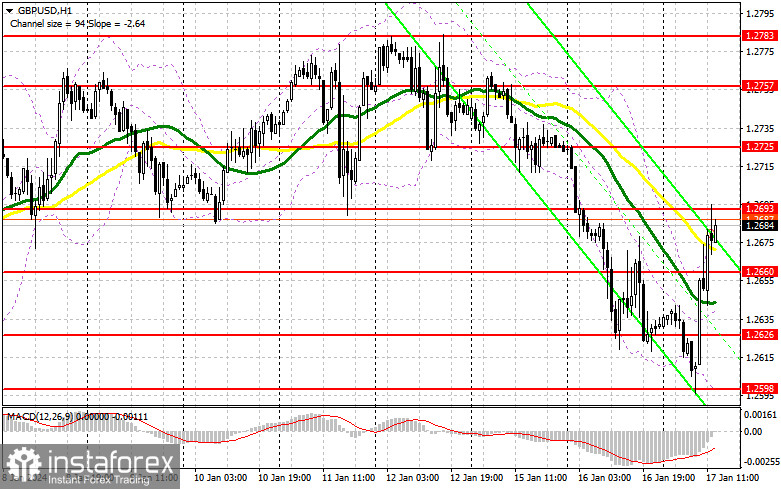
A sharp rise in inflation has allowed the pound to compensate for all recent losses and even reverse the bearish trend. But will the buyers have enough strength to maintain this advantage in the second half of the day - we shall see. Data on changes in retail sales, industrial production and speeches by FOMC members Michael S. Barr and Michelle Bowman are expected. If retail sales growth exceeds forecasts, it will pressure the pound, which I plan to take advantage of. Forming a false breakout around 1.2660 would provide a good entry point for long positions to continue the development of the new bullish market with the target of an upward movement towards 1.2696, where trading is currently taking place. A breakout and consolidation above this level will bring demand back to the pound and open the way to 1.2725, where I expect a more active seller presence. The ultimate target will be in the area of 1.2757, where I intend to take profits. In the scenario of GBP/USD decline, the absence of bullish activity at 1.2660, and strong US data, pressure on the pound will return. In this case, I will postpone purchases until the next support level of 1.2626. I plan to buy GBP/USD immediately on a rebound only from 1.2598 with the aim of a 30-35 point correction within the day.
To open short positions on GBP/USD, the following is required:
Sellers are currently retreating from the market, but with every strong upward movement, they make themselves known with a good correction. I suggest acting the same way in the second half of the day. A false breakout around the resistance level of 1.2693 after the release of US data will confirm the entry point for selling, from which I expect a retest of the nearest support level at 1.2660, formed as a result of the first half of the day. A breakout and a retest from below upwards of this range will seriously blow the bullish positions, disrupting the market balance and opening the way to 1.2626. The ultimate target will be in the area of 1.2598, where I intend to take profits. In the scenario of further GBP/USD growth and the absence of activity at 1.2693 in the second half of the day, which is likely to happen, buyers will regain the initiative. In this case, I will postpone sales until a false breakout at 1.2725. Without a downward movement, I will sell GBP/USD immediately on a rebound from 1.2757, but only with the expectation of a pair correction down by 30-35 points within the day.


Indicator signals:
Moving Averages
Trading is conducted around the 30 and 50-day moving averages, indicating an attempt by buyers to take the initiative.
Note: The author sets the period and prices of moving averages on the hourly chart H1 and differs from the general definition of classic daily moving averages on the daily chart D1.
Bollinger Bands
In case of a decline, the lower boundary of the indicator at around 1.2598 will act as support.
Description of indicators:
• Moving Average (MA) - determines the current trend by smoothing volatility and noise. Period 50. Marked on the chart in yellow.
• Moving Average (MA) - determines the current trend by smoothing volatility and noise. Period 30. Marked on the chart in green.
• MACD (Moving Average Convergence/Divergence) - Fast EMA period 12. Slow EMA period 26. SMA period 9.
• Bollinger Bands - Period 20.
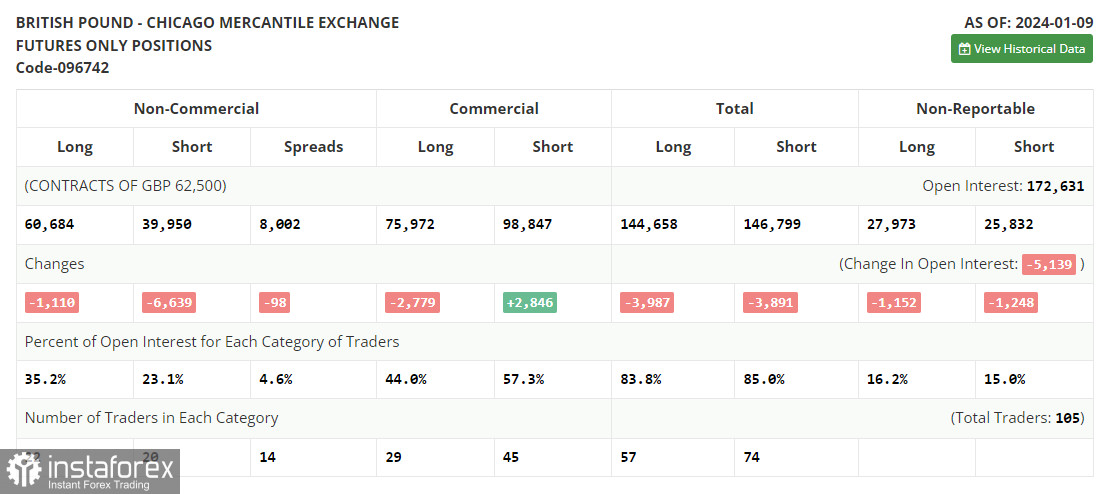
• Non-commercial traders - speculators, such as individual traders, hedge funds, and large institutions, use the futures market for speculative purposes and meet specific requirements.
• Long non-commercial positions represent the total long open positions of non-commercial traders.
• Short non-commercial positions represent the total short open positions of non-commercial traders.
• The total non-commercial net position is the difference between non-commercial traders' short and long positions.


