


Analysis of EUR/USD 5M
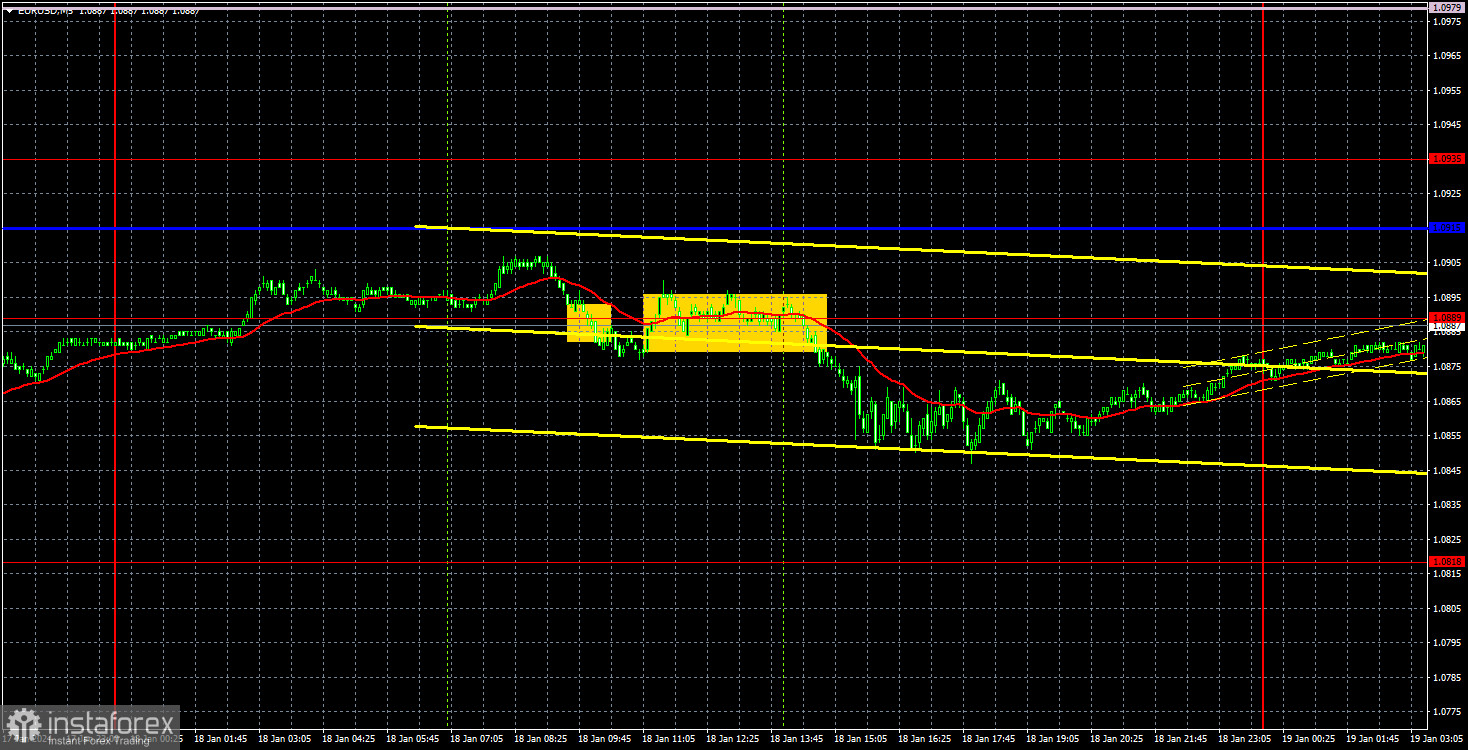
The EUR/USD downtrend remained intact on Thursday. The pair had clearly been in a flat phase for almost two weeks, but now there are at least some signs of recovery. Take note that a flat market is not favorable for traders. If there is no movement, it becomes extremely difficult to generate profits, no matter how you trade.
However, at the same time, volatility remains relatively low. There were hardly any significant events and reports this week, so market participants are not in a rush to open new positions. Several representatives of the Federal Reserve and the European Central Bank (ECB) delivered speeches, and, as before, their message is that there is no clear plan for monetary easing in 2024. Both central banks will act based on inflation and other macroeconomic data reflecting the state of the economy. Therefore, the market can only speculate on the actions of the central banks in the current year, and it tries to trade accordingly in the last month.
Yesterday, European Central Bank President Christine Lagarde delivered a speech, which was not distinctly different from the last one. Lagarde said that the ECB will consider the possibility of lowering rates closer to the summer. Therefore, there is no need to worry; interest rates in the European Union are unlikely to be lowered in January or March. The same applies to the United States. Despite market expectations for the first rate cut at the second meeting of the year, it is more likely that the start of the monetary easing cycle will be delayed.
Since movements were relatively weak yesterday, the trading signals were not very strong. The price generated two sell signals around the level of 1.0889 that were not very precise, afterwards it managed to fall by about 20-30 pips. Traders could have earned this amount of profit if they closed their positions manually closer to the evening, as there were simply no other signals available.
COT report:
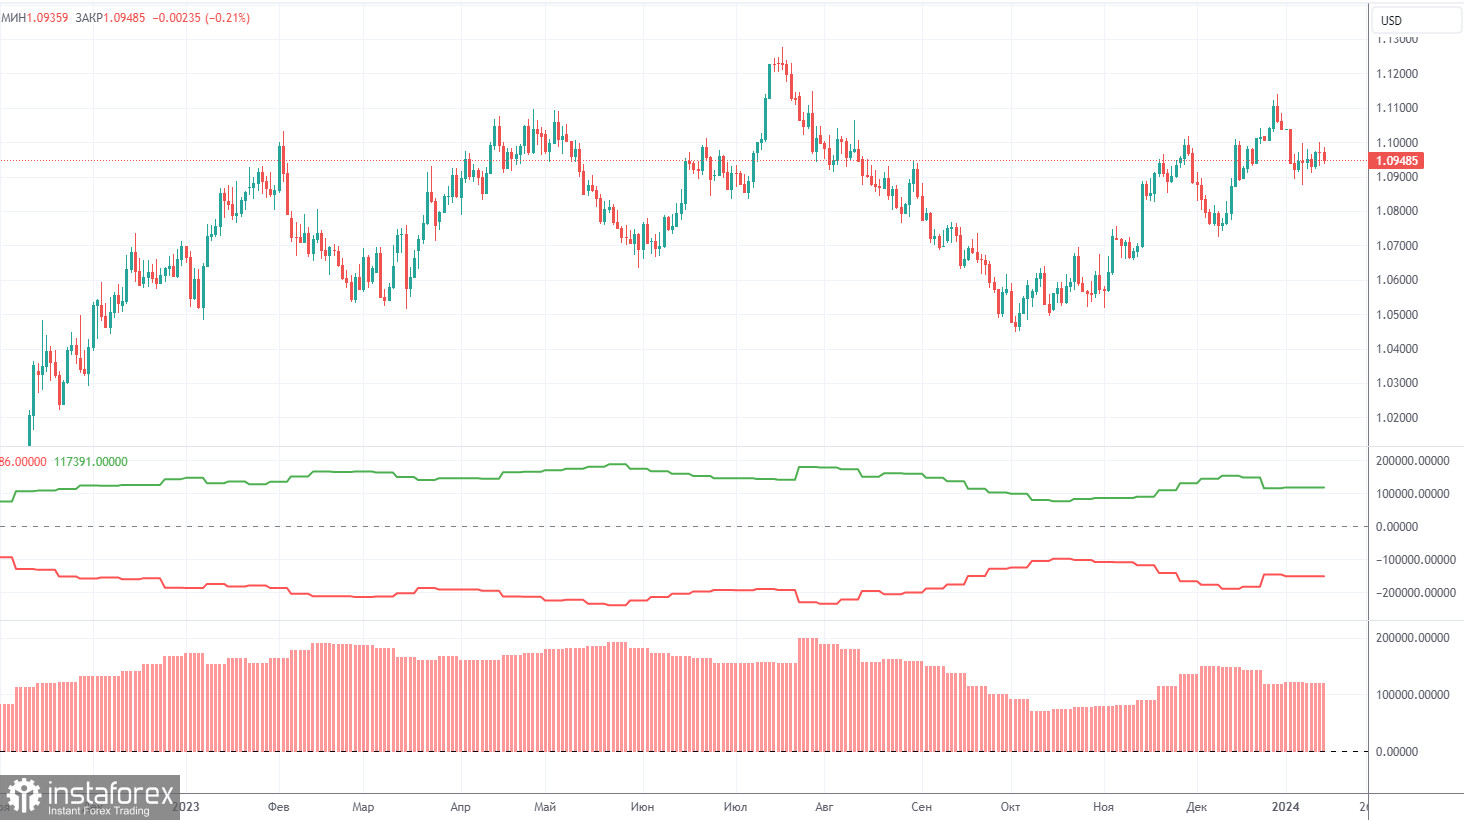
The latest COT report is dated January 2nd. In the first half of 2023, the net position of commercial traders hardly increased, but the euro remained relatively high during that period. Then, the euro and the net position both fell for several months, as we anticipated. However, in the last few weeks, both the euro and the net position have been rising. Therefore, we can conclude that the pair is correcting higher, but the corrections cannot last forever because they are just corrections.
We have previously pointed out that the red and green lines have moved significantly apart from each other, which often precedes the end of a trend. Currently, these lines are moving apart again. Therefore, we support the scenario where the euro should fall and the upward trend must end. During the last reporting week, the number of long positions for the non-commercial group increased by 700, while the number of short positions decreased by 1,300. Consequently, the net position increased by 2,000. The number of buy contracts is still higher than the number of sell contracts among non-commercial traders by 120,000. The gap is significant, and even without COT reports, it is clear that the euro should continue to fall.
Analysis of EUR/USD 1H
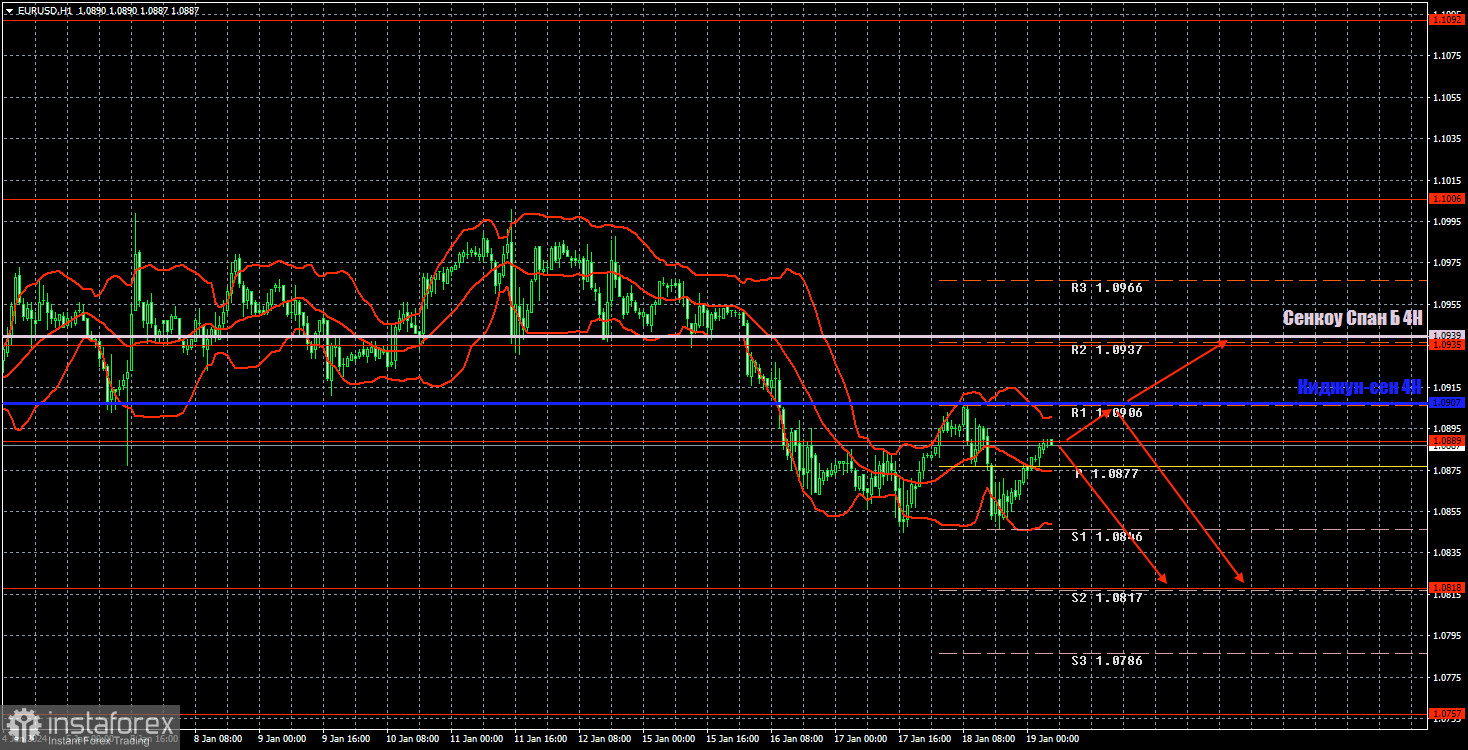
On the 1-hour chart, EUR/USD remains below the Ichimoku indicator lines, so the downtrend persists. The price surpassed the level of 1.0889, so the downtrend may gather momentum in the near future. We expect a pronounced decline from the euro.
Today, we believe that you may consider short positions using 1.0818 as the target. To do so, there should be a bearish price reversal near the level of 1,0889 or near the critical line. The euro could rise, which we can identify by the price closing above the Kijun-sen. However, the Senkou Span B line is quite close, so we wouldn't rush to open long positions.
On January 19, we highlight the following levels for trading: 1.0658-1.0669, 1.0757, 1.0818, 1.,0889, 1.0935, 1.1006, 1.1092, 1.1137, 1.1185, 1.1234, 1.1274, as well as the Senkou Span B line (1.0939) and the Kijun-sen (1.0907). The Ichimoku indicator lines can shift during the day, so this should be taken into account when identifying trading signals. Don't forget to set a breakeven Stop Loss if the price has moved in the intended direction by 15 pips. This will protect you against potential losses if the signal turns out to be false.
On Friday, Lagarde will speak again, but it's unlikely for her to announce anything new compared to her other speeches this week. The US docket includes secondary reports on new home sales and the University of Michigan consumer sentiment.
Description of the chart:
Support and resistance levels are thick red lines near which the trend may end. They do not provide trading signals;
The Kijun-sen and Senkou Span B lines are the lines of the Ichimoku indicator, plotted to the 1H timeframe from the 4H one. They provide trading signals;
Extreme levels are thin red lines from which the price bounced earlier. They provide trading signals;
Yellow lines are trend lines, trend channels, and any other technical patterns;
Indicator 1 on the COT charts is the net position size for each category of traders;
Indicator 2 on the COT charts is the net position size for the Non-commercial group.


