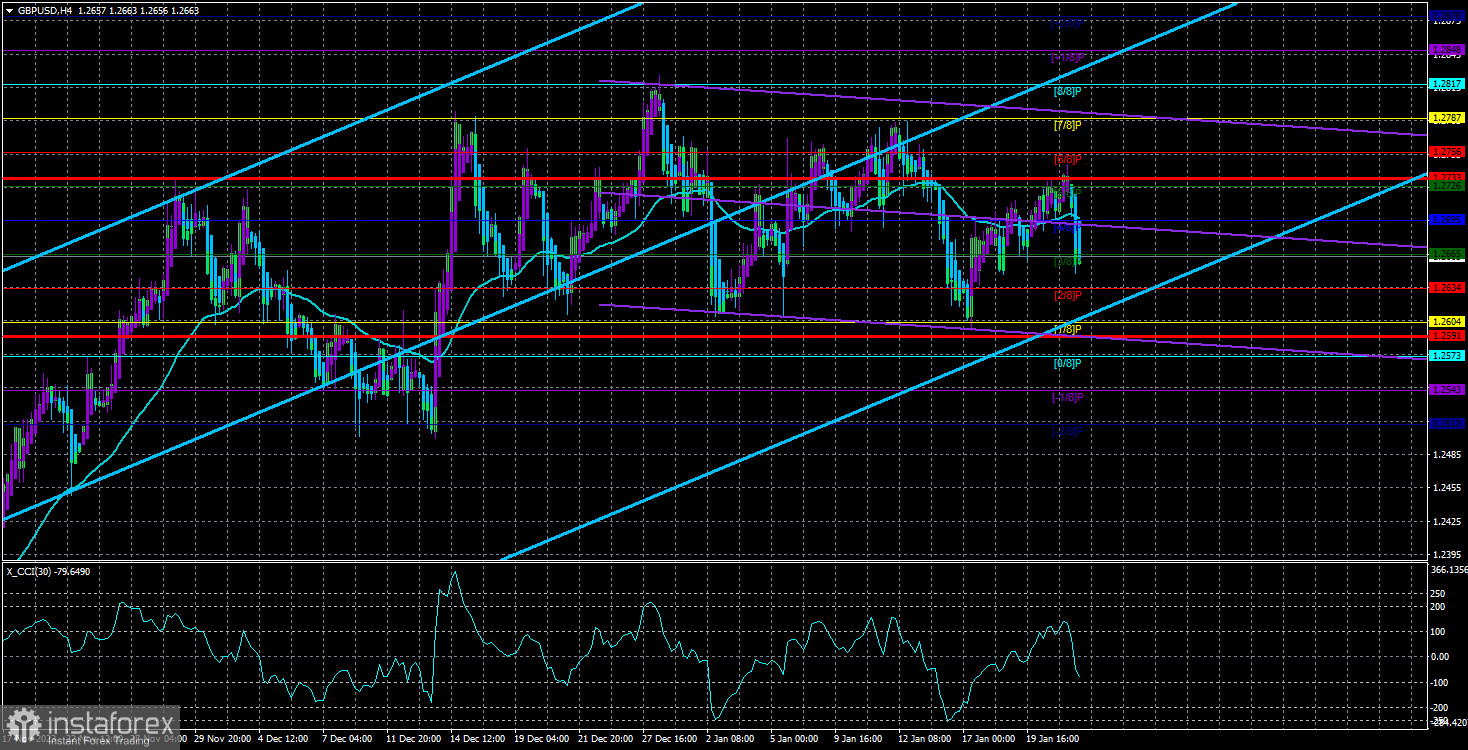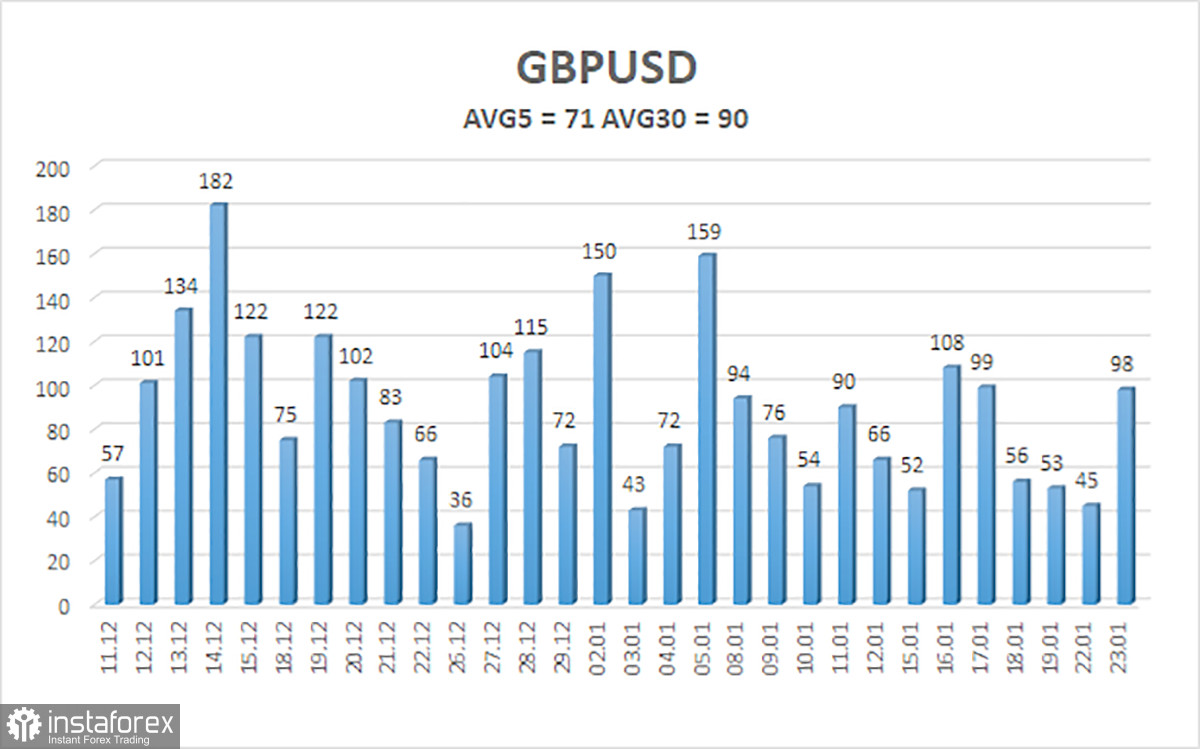
Once again, the GBP/USD currency pair did not have the highest volatility on Tuesday, but things were better than on Friday and Monday. However, everything has stayed the same in terms of technical, fundamental, and macroeconomic aspects. The pound still maintains excellent prospects for starting a new phase of prolonged decline, remains within a sideways channel on the 4-hour timeframe, and exhibits relatively weak volatility (as seen in the illustration below).
The fundamental background remains the same, and the market still somehow interprets it in favor of the British currency rather than the American one (which we will discuss below). The macroeconomic background is also unchanged. Statistics from across the ocean have been much stronger than those from the United Kingdom for quite some time. This is evident in inflation figures, GDP indicators, labor market, salary, and unemployment data.
As with the European currency, we consider the recent growth over the last 3–4 months a "correction." If this correction ends (as it should), we will see a new strong downward impulse with targets below the 20th level, where the last local minimum is located. We have been forecasting this significant move for the past couple of months. The problem currently lies in the market refusing to sell the pound and buy the dollar, so the pair has been in a flat for over a month.
It's very difficult to say how much longer the flat will last. A flat is a movement that is almost impossible to predict in advance. Essentially, it signifies that the market has reached a state of equilibrium between bulls and bears, with neither side having the upper hand. For the flat to end, buyers or sellers must open positions actively, pushing the opposing side out of the market. However, this also requires reason and strength.
If players have no desire to open large positions, the flat will persist. We know that fundamentals and macroeconomics are not always determining market sentiment. In other words, they can influence market sentiment but can also be ignored.
A recent example is the current period of the flat, where practically everything points to the fact that the dollar should rise. However, as with the ECB, the market somehow believes that the Bank of England will start easing monetary policy later than the Fed, even though we have already seen that in the United States, no one plans to lower the rate in March. Expert forecasts suggest the Bank of England will start lowering the rate in August. There is little time between May and August. Such a time divergence must be considered good for the dollar, especially considering the higher Fed rate.
However, the market continues to trade as if the Fed will cut rates in January and the Bank of England will do so in January of the following year. The British regulator may start easing slightly later than the Fed, but the difference will be minimal. In the UK, inflation was initially much higher than in the US, which may prompt the Bank of England to keep the rate higher for a little longer. But, as mentioned before, the difference is likely to be insignificant.
Therefore, we continue to advocate for a decline in the British currency. The beginning of this movement can only be identified by the price firmly breaking below the sideways channel of 1.2610-1.2787.

The average volatility of the GBP/USD currency pair over the last five trading days as of January 24th is 71 points. For the GBP/USD pair, this value is considered "average." Therefore, on Wednesday, January 24th, we expect the pair to move within the range limited by the levels of 1.2591 and 1.2733. An upward reversal of the Heiken Ashi indicator will indicate a new phase of upward movement within the sideways channel.
Nearest support levels:
S1 - 1.2665
S2 - 1.2634
S3 - 1.2604
Nearest resistance levels:
R1 - 1.2695
R2 - 1.2726
R3 - 1.2756
Explanations for the illustrations:
Linear regression channels - help determine the current trend. If both channels point in the same direction, the trend is currently strong.
The moving average line (settings 20.0, smoothed) - determines the short-term trend and the direction in which trading should be conducted.
Murray levels - target levels for movements and corrections.
Volatility levels (red lines) - the likely price channel in which the pair will move over the next day based on current volatility indicators.
CCI indicator - its entry into the overbought territory (above +250) or oversold territory (below -250) indicates an impending trend reversal in the opposite direction.


