The outcomes of the European Central Bank (ECB) meeting held on Thursday failed to provide significant support to the euro and did not cause a surge in market volatility or in the EUR/USD pair. ECB President Christine Lagarde noted that it is premature to discuss transitioning to easing monetary policy parameters at this moment. At the same time, she stated that the decisions of the bank's Governing Council would depend on the data.

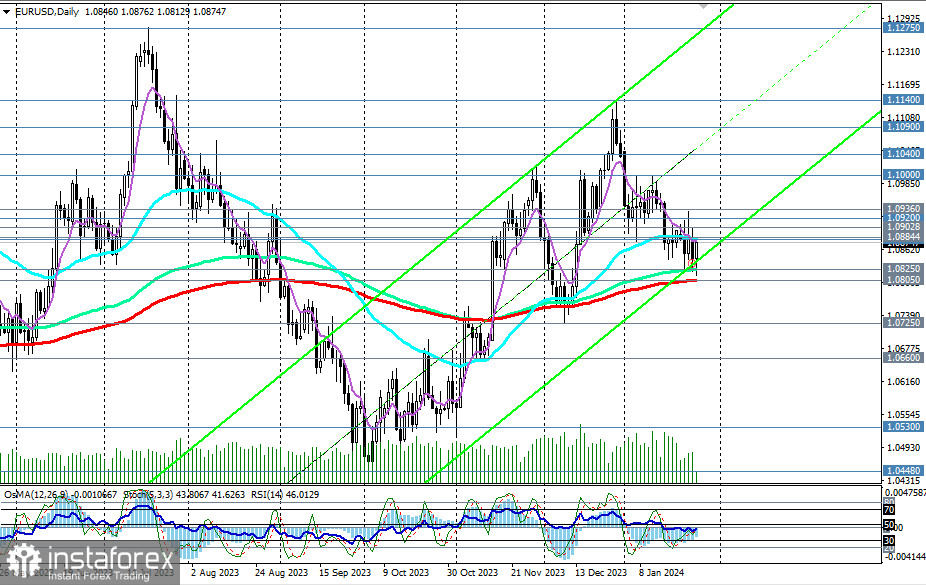
Nonetheless, the EUR/USD ended the trading day on a negative note on Thursday, testing the important medium-term support level of 1.0825 (144 EMA on the daily chart) for a breakdown.
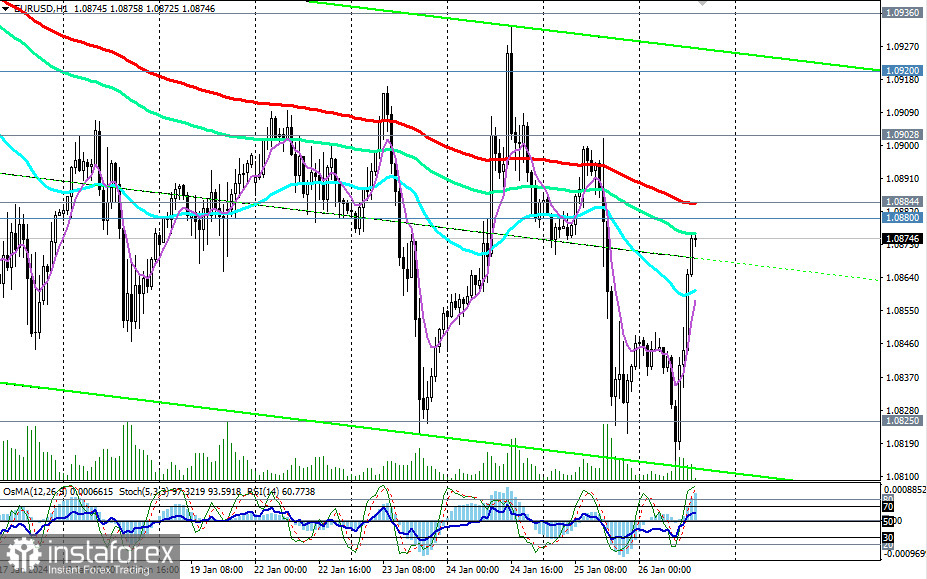
During Friday's Asian trading session, pressure on the pair intensified, and it dropped to the 1.0813 mark. However, with the start of the European trading session, the pair's dynamic changed to the opposite direction, and the price rose to the intraday high of 1.0876.

If the price had risen slightly higher, and the breakout of the important short-term resistance level of 1.0884 (200 EMA on the 1-hour chart) could have signaled the opening of long positions with the nearest target near the resistance level of 1.0902 (200 EMA on the 4-hour chart).
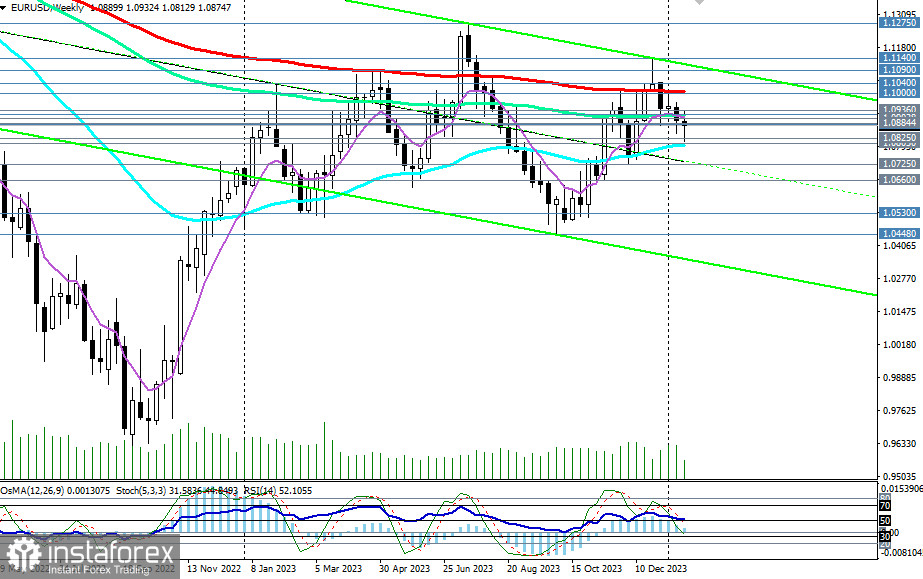
In the case of its breakout, the resistance levels of 1.1000 (200 EMA on the weekly chart) and 1.1040 (50 EMA on the monthly chart) could become the growth targets. Their breakout, in turn, would bring EUR/USD into the long-term bullish market zone, making long-term long positions preferable with targets at the global resistance level of 1.1630 (200 EMA on the monthly chart).

In the main scenario, a break below the 1.0846 mark (Friday's opening price) could be the very first signal to sell the pair with the nearest targets at the key medium-term support levels of 1.0825 (144 EMA on the daily chart), 1.0805 (200 EMA on the daily chart).
Their breakdown and further decline would bring EUR/USD into the medium-term bearish market zone, intensifying the downward dynamic within the long-term bearish market.
The decline targets in case this scenario materializes are the local support levels of 1.0530, 1.0450, and then the marks of 1.0400, 1.0300, near which the lower boundary of the downward channel on the weekly chart passes.
Nonetheless, short positions remain preferable below the marks of 1.0884, 1.0900.
Support levels: 1.0825, 1.0805, 1.0800, 1.0725, 1.0700, 1.0660, 1.0600, 1.0530, 1.0500, 1.0450, 1.0400, 1.0300
Resistance levels: 1.0880, 1.0884, 1.0900, 1.0902, 1.0920, 1.0936, 1.1000, 1.1010, 1.1040, 1.1090, 1.1100, 1.1140, 1.1200, 1.1275, 1.1300, 1.1400, 1.1500, 1.1530, 1.1600, 1.1630
Trading scenarios
Main scenario: Sell Stop 1.0840. Stop-Loss 1.0890. Targets 1.0825, 1.0805, 1.0800, 1.0725, 1.0700, 1.0660, 1.0600, 1.0530, 1.0500, 1.0450, 1.0400, 1.0300
Alternative scenario: Buy Stop 1.0890. Stop-Loss 1.0840. Targets 1.0900, 1.0902, 1.0920, 1.0936, 1.1000, 1.1010, 1.1040, 1.1090, 1.1100, 1.1140, 1.1200, 1.1275, 1.1300, 1.1400, 1.1500, 1.1530, 1.1600, 1.1630
"Targets" correspond to support/resistance levels. This does not necessarily mean they will be reached, but can serve as a guide for planning and placing your trading positions.


