


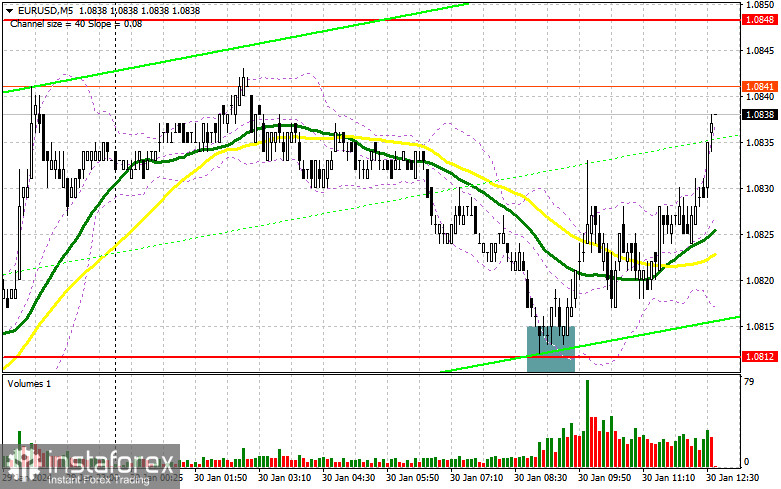
In my morning forecast, I highlighted the level of 1.0812 and planned to make decisions on market entry based on it. Let's look at the 5-minute chart and analyze what happened there. The decline and the formation of a false breakout around 1.0812 allowed for a buying signal, counting on a small pair correction after the data release for the eurozone countries, resulting in a 30-point upward movement. The technical picture for the second half of the day remained unchanged.
To open long positions on EUR/USD, the following is required:
The released GDP data for the eurozone slightly pleased traders, as many economists expected a slowdown in economic growth, but this was avoided by the fourth quarter's results. Data for various countries, including Germany, generally exceeded economists' expectations, allowing the euro to withstand a new sell-off. Ahead of us are quite interesting figures on the US Consumer Confidence Index, and excellent indicators expected can significantly harm the pair's upward potential. Data on changes in the S&P/Case-Shiller 20-City Composite Home Price Index and the Home Price Index will be of little interest.
As noted above, the technical picture has stayed the same, so I will act according to the previous scenario. Of course, I would like another test and defense of 1.0812. Only the formation of a false breakout in this area, similar to what I analyzed above, will be a suitable option for entering the market, counting on an upward correction to around 1.0848, where the moving averages are playing in favor of sellers. Breaking and updating this range from top to bottom will provide an opportunity to buy with the development of a more powerful upward correction and the prospect of updating 1.0885. The ultimate target will be a maximum of 1.0931, where I will take profits. In the case of a decline in EUR/USD and the absence of activity at 1.0812 in the second half of the day, which will only happen in the case of strong US data, pressure on the pair will increase. In this case, I plan to enter the market only after forming a false breakout around 1.0780. I will consider opening long positions immediately on a rebound from 1.0744 with the goal of an upward correction of 30-35 points within the day.
To open short positions on EUR/USD, the following is required:
Bears performed well in the first half of the day but failed to break even the intermediate support of 1.0812. In the case of the euro rising and a bullish reaction to US statistics in the second half of the day, only the formation of a false breakout at 1.0848, similar to what I discussed yesterday, will indicate the presence of major players in the market, which may lead to another downward movement of the pair to around 1.0812. Only a breakthrough and consolidation below this range, as well as a reverse test from bottom to top, will provide another selling point with the collapse of the pair to around 1.0780. The ultimate target will be a minimum of 1.0744, where I will take profits. In the case of upward movement of EUR/USD in the second half of the day and the absence of bears at 1.0848, demand for EUR/USD will return, which may allow the euro to recover slightly, returning trading to the range of a sideways channel. In this case, I will postpone sales until testing the next resistance at 1.0885. I will also sell there, but only after an unsuccessful consolidation. I plan to open short positions immediately on a rebound from 1.0931 with the goal of a downward correction of 30-35 points.
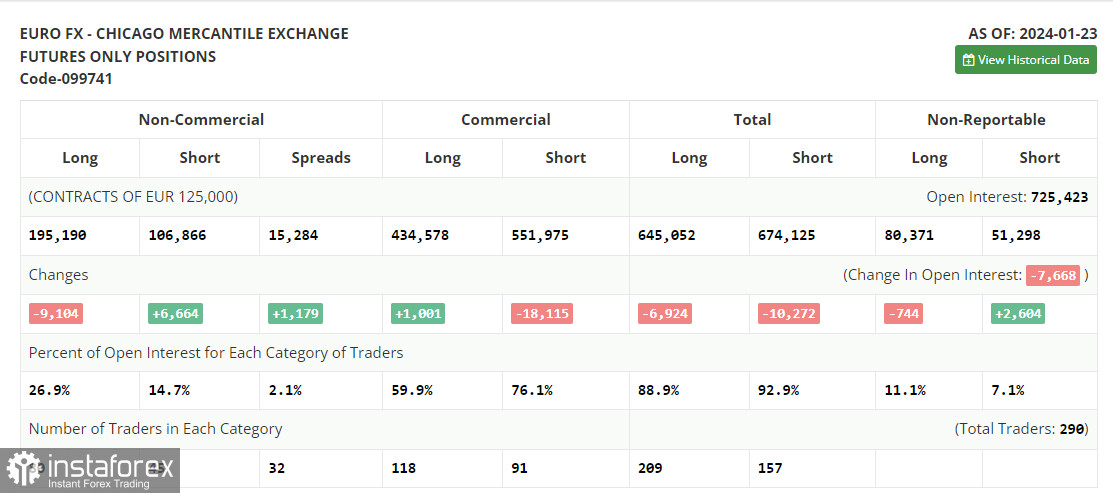
In the COT report (Commitment of Traders) as of January 23, there was a reduction in long positions and an increase in short positions, indicating changes in the balance of forces in favor of the US dollar. Obviously, after the meeting of the European Central Bank, where the leadership made it clear that it plans to lower rates this summer, pressure on the euro returned. In pairs with the same US dollar, risk buyers have nothing to catch so far, as the strong US economy will allow the Federal Reserve to stick to a tough policy without fearing the onset of a recession, which cannot be said about the economy of the eurozone. In the near future, a meeting of the Open Market Committee will take place, the results of which will make it clear what the regulator plans to do next with its policy. The COT report indicates that long non-commercial positions decreased by 9,104 to 195,190, while short non-commercial positions increased by 6,664 to 106,866. As a result, the spread between long and short positions increased by 1179.
Indicator signals:
Moving averages
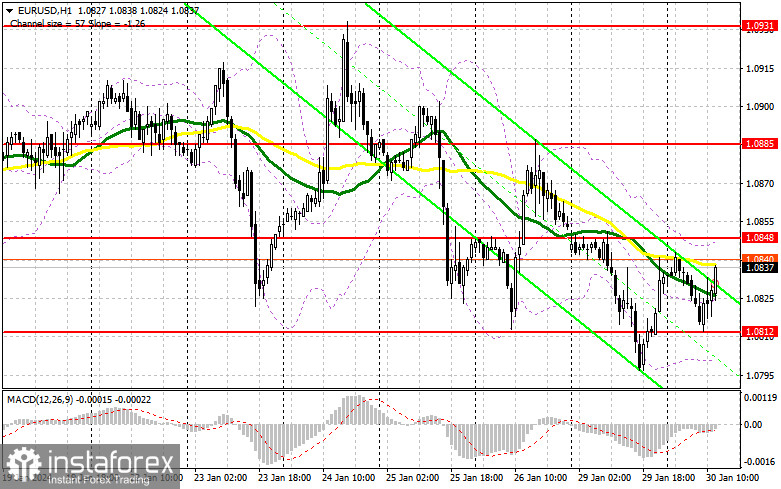
Trading is carried out around the 30 and 50-day moving averages, indicating a sideways market.
Note: The author considers the period and prices of moving averages on the hourly chart H1 and differs from the general definition of classical daily moving averages on the daily chart D1.
Bollinger Bands
In case of a decline, the lower boundary of the indicator at around 1.0800 will act as support.
Indicator descriptions:
- Moving average (determines the current trend by smoothing volatility and noise). Period 50. Marked on the chart in yellow.
- Moving average (determines the current trend by smoothing volatility and noise). Period 30. Marked on the chart in green.
- MACD indicator (Moving Average Convergence/Divergence - convergence/divergence of moving averages). Fast EMA period 12. Slow EMA period 26. SMA period 9.
- Bollinger Bands. Period 20.
- Non-commercial traders - speculators, such as individual traders, hedge funds, and large institutions, use the futures market for speculative purposes and meet certain requirements.
- Long non-commercial positions represent the total long open position of non-commercial traders.
- Short non-commercial positions represent the total short open positions of non-commercial traders.
- The total non-commercial net position is the difference between non-commercial traders' short and long positions.


