


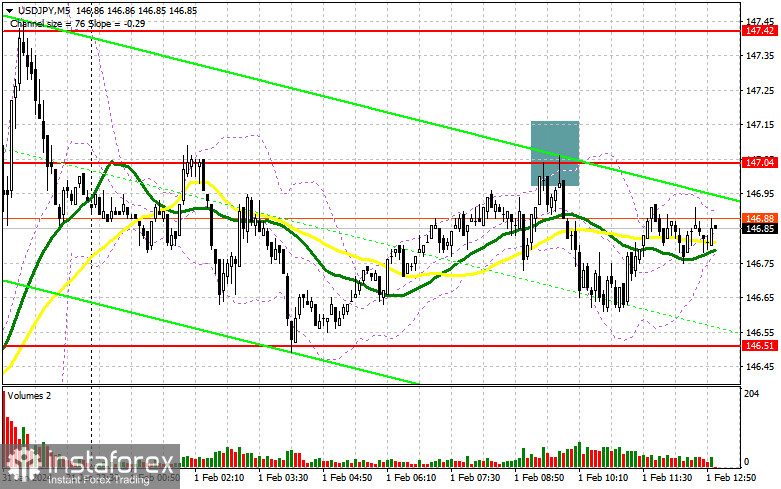
In my morning forecast, I emphasized the level of 147.04 and planned to make trading decisions based on it. Let's take a look at the 5-minute chart and analyze what happened. The rise and the formation of a false breakout around 147.04 led to an excellent selling point for the dollar, resulting in a drop of more than 40 points. The technical picture still needs to be revised for the second half of the day.
To open long positions on USD/JPY:
The unclear attempt by the dollar to reclaim even a part of yesterday's positions only led to another round of selling. However, it is fair to note that a significant decline only occurred after this. Everything will now depend on a series of US data related to the labor market. A sharp increase in initial jobless claims will be another reminder that the situation is gradually deteriorating. The ISM manufacturing index and changes in non-farm labor productivity in the non-manufacturing sector will also favor the market.
In the second half of the day, I plan to act on the purchases according to the morning plan as low as possible and after forming a false breakout around 146.51. Strong US labor market data will be the key to the success of the dollar's upward trend, aiming for another retest of the 147.04 level, which the pair hit today. Breaking and retesting the upper range of this level will lead to another scenario for increasing long positions, capable of pushing USD/JPY up to around 147.42, where the moving averages intersect. The ultimate target will be the 147.86 area, where I plan to take profit.
In the scenario of a pair decline and the absence of activity from buyers at 146.51 in the second half of the day, pressure on the dollar will return, leading to another major sell-off. In this case, I will try to enter the market around 146.05 – the last hope of buyers. Only a false breakout will there be a good condition for opening long positions. I plan to buy USD/JPY immediately on a rebound from the minimum of around 145.61, with the goal of a correction of 30-35 points within the day.
To open short positions on USD/JPY:
Sellers have made themselves known, but achieving a major dollar sell-off has failed. Many now rely on US data and a weak job market. In case of another bearish rise, bears must defend the resistance at 147.04 again. A false breakout there, similar to what I discussed above, will be a suitable scenario for selling with the aim of a decrease to around 146.51. Breaking and retesting the lower range of this zone after the data will deal a more serious blow to buyer positions, leading to stop-loss hunting and opening the way to 146.05. The ultimate target will be the 145.61 area, where I plan to take profit. Buyers will regain the advantage in the USD/JPY growth scenario and the absence of activity at 147.04 in the second half of the day. In this case, postponing sales until testing the next resistance at 147.42 is best. If there is no downward movement, I will sell USD/JPY immediately on a rebound from 147.86, but only counting on a pair correction down by 30-35 points within the day.
Indicator Signals:
Moving Averages:
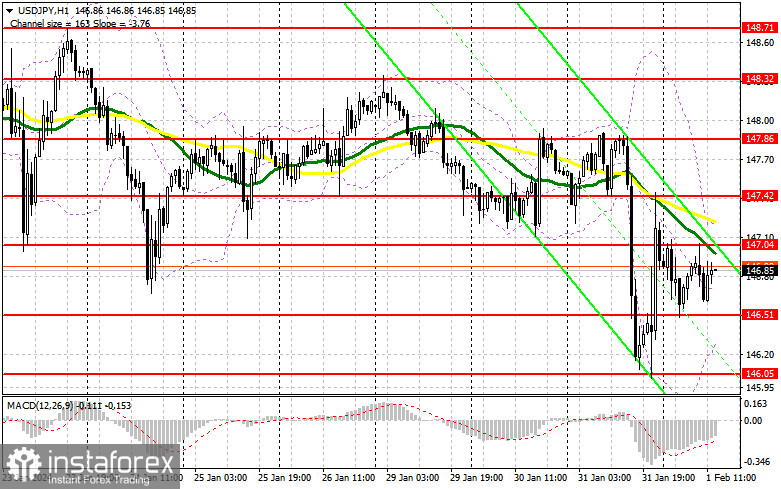
Trading is below the 30 and 50-day moving averages, indicating a further decline in the pair.
Bollinger Bands:
In the event of a decline, the lower boundary of the indicator will act as support around 146.35.
Description of Indicators:
- Moving Average (MA) - A trend indicator that shows the current trend by smoothing volatility and noise. Period 50. Marked on the chart in yellow.
- Moving Average (MA) - A trend indicator that shows the current trend by smoothing volatility and noise. Period 30. Marked on the chart in green.
- Moving Average Convergence/Divergence (MACD) - A trend-following momentum indicator that shows the relationship between two moving averages of a security's price. Fast EMA period 12. Slow EMA period 26. SMA period 9.
- Bollinger Bands - Volatility indicator consisting of a middle band being an N-period simple moving average (SMA), an upper band at K times an N-period standard deviation above the middle band, and a lower band at K times an N-period standard deviation below the middle band.
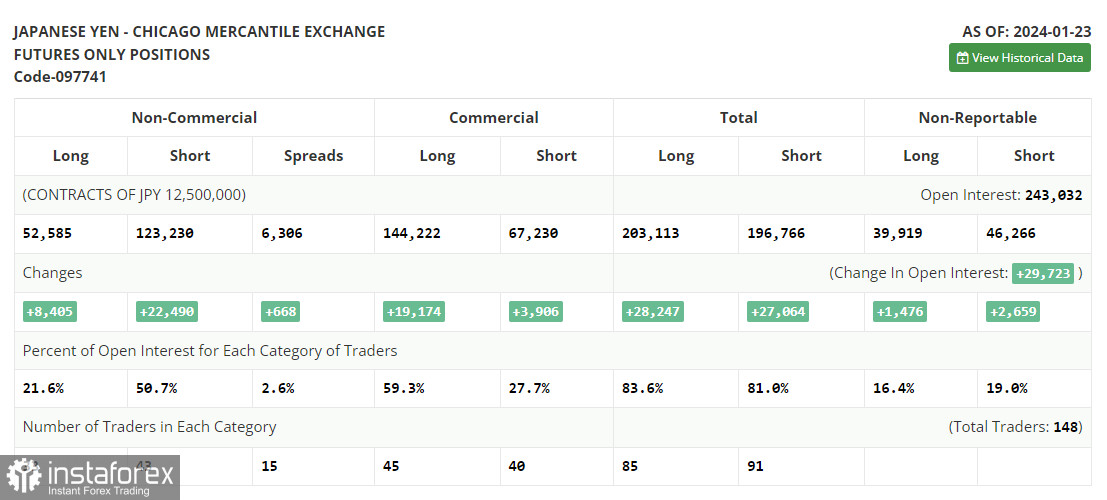
- Non-commercial traders - speculators such as individual traders, hedge funds, and large institutions that use the futures market for speculative purposes and meet specific requirements.
- Long non-commercial positions represent the total long open position of non-commercial traders.
- Short non-commercial positions represent the total short open positions of non-commercial traders.
- The total non-commercial net position is the difference between non-commercial traders' short and long positions.


