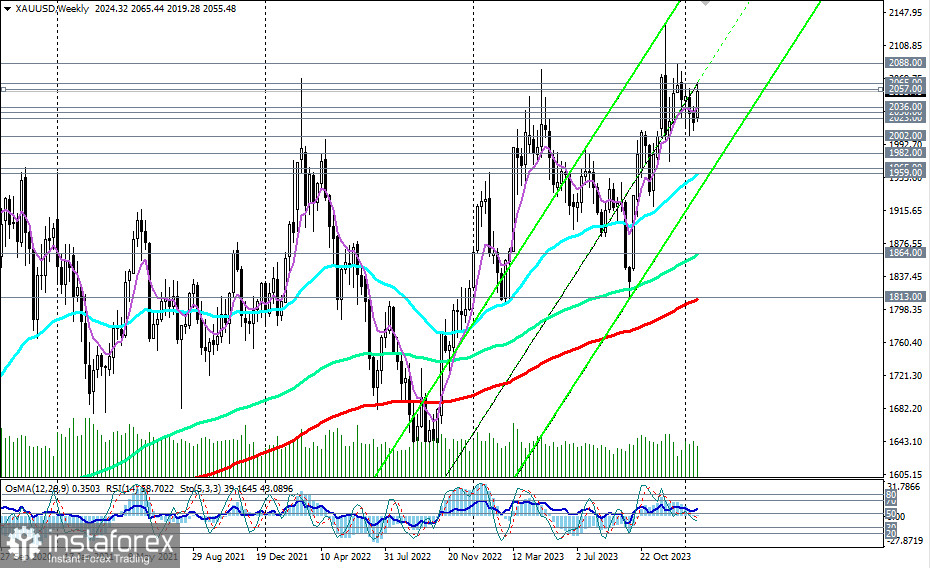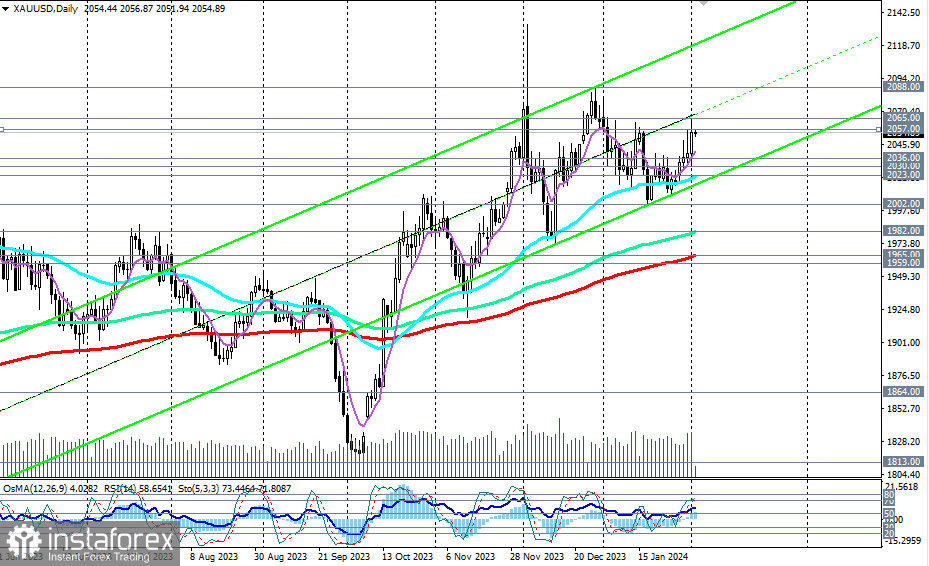
From mid-October 2023, XAU/USD has been trading in an upward medium-term trend, since January 2019 in an upward long-term trend, and since January 2002 in an upward global trend.
Therefore, considering fundamental factors, long-term investors should adhere to the "buy-and-hold" strategy, while medium-term and investors preferring short-term deals may want to look for potential entry points into the market, preferring long positions as well.
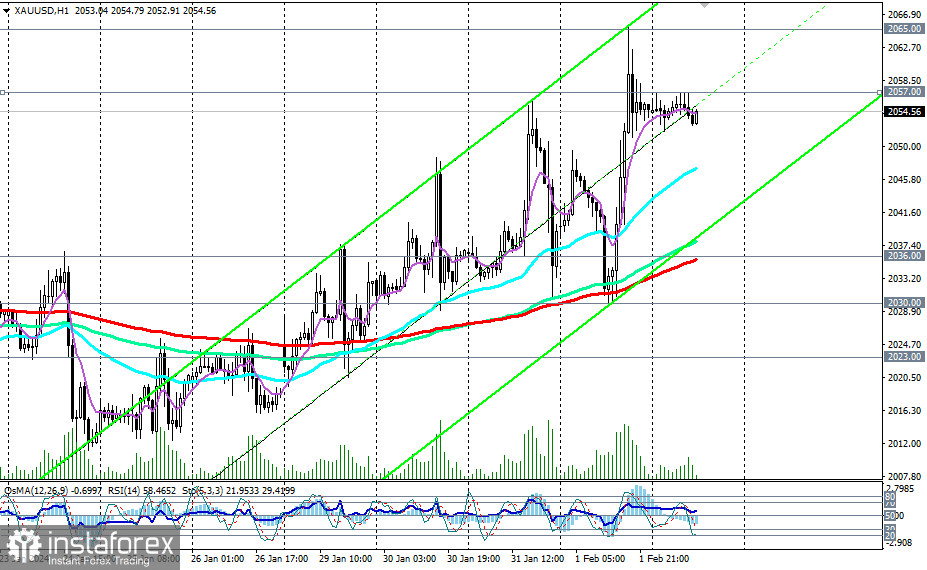
From this perspective, a quick signal for entering long positions could be the breakout of the local resistance level 2057.00 with the prospect of rising to yesterday's and the 4-week high near the mark of 2065.00.

In an alternative scenario, a break below local support levels 2052.00, 2051.00 could be the first signal to resume short positions with the nearest targets at support levels 2047.00 (200 EMA on the 15-minute chart), 2036.00 (200 EMA on the 1-hour chart).
A breakdown of support levels 2030.00 (200 EMA on the 4-hour chart) and 2023.00 (50 EMA on the daily chart) could trigger a decline towards the important medium-term support level of 1982.00 (144 EMA on the daily chart). In case of further decline and after breaking through medium-term support levels of 1965.00 (200 EMA on the daily chart), 1959.00 (50 EMA on the weekly chart), XAU/USD may head towards the key support level of 1813.00 (200 EMA on the weekly chart). Its breakdown will lead XAU/USD into the long-term bear market zone.

Long positions remain preferable for now. However, the situation may change if today's U.S. Department of Labor report surprises the markets with strong indicators. In this case, one should expect a strengthening of the dollar and a decline in XAU/USD.
Support levels: 2052.00, 2051.00, 2048.00, 2036.00, 2030.00, 2023.00, 2002.00, 1982.00, 1965.00, 1959.00
Resistance levels: 2057.00, 2060.00, 2065.00, 2070.00, 2080.00, 2088.00
Trading Scenarios:
Main Scenario: Buy Stop 2058.00. Stop-Loss 2052.00. Targets 2060.00, 2065.00, 2070.00, 2080.00, 2088.00
Alternative Scenario: Sell Stop 2051.00. Stop-Loss 2058.00. Targets 2048.00, 2036.00, 2030.00, 2023.00, 2002.00, 1982.00, 1965.00, 1959.00
"Targets" correspond to support/resistance levels. This also does not imply that they will necessarily be reached but can serve as a guide in planning and placing trading positions.


